Category Archives: Blogging

Lipid Extraction Kit – A Comprehensive Guide for Accurate and Reproducible Lipidomics

Lipids are one of the most structurally diverse and functionally critical biomolecules in biology. They serve as membrane components, energy reserves, signaling molecules, and metabolic intermediates. The ability to extract and analyze lipids precisely from biological samples has become central to lipidomics, metabolomics, and cellular biochemistry.
The Lipid Extraction Kit simplifies this process by providing a ready-to-use, reproducible, and standardized workflow that minimizes solvent handling and variability between users.

Overview of Lipid Extraction in Modern Research

Lipids vary widely in polarity and solubility — from nonpolar triacylglycerols to highly polar phosphoinositides. Traditional extraction techniques such as Folch or Bligh and Dyer protocols rely on biphasic solvent systems combining chloroform, methanol, and water. These methods are highly efficient but require hazardous chemicals and are difficult to standardize.

Modern lipid extraction kits replace these solvent mixtures with safer, pre-formulated reagents, enabling reproducible lipid recovery across diverse sample types. They support workflows in research areas such as:

  • Cell metabolism

  • Neurochemistry

  • Cardiovascular lipidomics

  • Nutritional science

  • Environmental and agricultural lipid analysis

For a background on lipid chemistry and biological functions, you can explore educational resources from NCBI Bookshelf, PubChem, and National Center for Biotechnology Information (NCBI).

AffiEXTRACT® Lipid Extraction Kit

Importance of Lipid Extraction Kits

The precision of lipidomics begins with extraction. A poor extraction step can result in selective loss of lipid species, oxidation artifacts, or matrix interference that distorts quantification. Kits provide:

  • Controlled phase separation, eliminating manual solvent mixing errors.

  • High recovery yield across lipid classes like phosphatidylcholine (PC), phosphatidylethanolamine (PE), ceramides, cholesteryl esters (CE), and triacylglycerides (TAG).

  • Reproducible results ideal for high-throughput lipidomics workflows.

The U.S. National Institutes of Health (NIH) provides extensive guidelines on lipidomics data reproducibility, emphasizing the importance of standard extraction and sample handling methods.

Scientific Principles of Lipid Extraction

Lipids are hydrophobic and partition into nonpolar organic solvents. The goal of extraction is to efficiently transfer them from the aqueous biological matrix into the organic phase without degradation.

 Solvent Partitioning

Extraction depends on differential solubility. Methanol breaks protein–lipid interactions, while nonpolar solvents such as hexane or methyl-tert-butyl ether (MTBE) solubilize hydrophobic lipids.
The phase separation occurs due to differences in density, allowing clean recovery of the lipid layer.

The U.S. Food and Drug Administration (FDA) and Environmental Protection Agency (EPA) discuss solvent safety in lipid chemistry under EPA Chemical Safety Reports and FDA laboratory practices.

 Avoiding Lipid Oxidation

Lipids containing unsaturated fatty acids are susceptible to oxidation. Extraction kits include antioxidants (e.g., butylated hydroxytoluene, BHT) or perform extraction under nitrogen to prevent degradation (NIST.gov).

 Protein Precipitation

Proteins can trap lipids; therefore, initial methanol treatment denatures proteins, freeing bound lipids for efficient partitioning.

Step-by-Step Workflow of a Lipid Extraction Kit

A typical workflow includes:

  1. Sample preparation:
    Homogenize 10–50 mg of tissue or pellet 1–5×10⁵ cells.
    Avoid repeated freeze-thaw cycles to preserve lipid integrity.
    (CDC.gov laboratory biospecimen handling)

  2. Add Extraction Buffer A:
    Methanol-based reagent breaks hydrophilic interactions and denatures proteins.

  3. Add Organic Reagent B:
    Proprietary solvent dissolves hydrophobic lipids and forms an upper or lower phase depending on density. (CellBioLabs protocol)

  4. Centrifuge at 10,000×g for 10 min.
    This separates the organic phase (lipid-rich) from the aqueous one.

  5. Transfer the organic phase carefully.
    Use a glass pipette to avoid plastic leaching (important for LC-MS).

  6. Dry under nitrogen or vacuum concentrator.
    Nitrogen prevents oxidation of unsaturated lipids.

  7. Reconstitute in isopropanol or hexane:
    Suitable for LC-MS or colorimetric quantification.

  8. Store at –20 °C or lower:
    Long-term stability guidance from NIST Lipidomics Reference Materials.

Types of Lipids Extracted

Each kit is optimized to capture broad lipid classes, such as:

Lipid Class Example Molecules Research Relevance
Glycerophospholipids Phosphatidylcholine, Phosphatidylethanolamine Membrane structure, signaling
Sphingolipids Ceramide, Sphingomyelin Apoptosis, cell recognition
Sterols Cholesterol, Ergosterol Hormone precursors, membranes
Neutral lipids Triacylglycerides Energy storage
Glycolipids Cerebrosides, Gangliosides Brain and nerve tissue metabolism

The Lipid Maps Consortium at UC San Diego provides comprehensive lipid databases and classification resources.

Technical Parameters and Optimization

 Extraction Efficiency

Recovery rates depend on sample matrix, solvent polarity, and lipid class. Studies from PubMed Central show MTBE-based extractions achieve 95–98 % recovery for most lipid classes.

 Solvent Safety

EPA regulations classify chloroform as hazardous; hence, most commercial kits use safer alternatives such as isopropanol or hexane. (EPA.gov)

 Matrix Adaptation

Different biological materials—blood, liver, adipose tissue—have unique lipid compositions. Optimization may include increased solvent ratios or additional vortexing steps.
Protocols from USDA Agricultural Research Service illustrate lipid extraction adaptations for food and plant matrices.

Data Quality and Standardization

Reproducible lipidomics depends on consistent extraction and quantification.
Key recommendations from National Institute of Standards and Technology (NIST) include:

  • Use of internal standards to normalize extraction efficiency.

  • Validation with standard reference materials (SRM 1950: Human Plasma).

  • Inclusion of procedural blanks and QC samples.

  • Consistent solvent ratios and extraction times.

Many academic consortia such as NIH Common Fund Metabolomics Program support inter-lab standardization to improve lipidomic reproducibility.

Applications of Lipid Extraction Kits

 Biomedical Research

Used in cancer metabolism, neurodegeneration, cardiac lipid metabolism, and cell signaling studies.
For example, NIH researchers use standardized lipid extraction prior to LC-MS to map lipid species in brain tissues (ncbi.nlm.nih.gov).

 Food and Nutrition Science

Lipid extraction enables quantification of fatty acid composition in oils, dairy, and plant materials. The U.S. Department of Agriculture (USDA) describes lipid extraction methods in FoodData Central.

 Environmental Analysis

Monitoring lipid-like organic pollutants (e.g., PAHs, PCBs) in soil or aquatic samples. Guidance available from EPA Analytical Chemistry Division.

 Microbial and Plant Lipidomics

Essential for studying algal lipid production for biofuel research. Department of Energy (DOE) projects rely on standardized extraction for lipid quantification in algae.

Storage and Stability of Extracted Lipids

After extraction, lipid samples must be stored properly to avoid degradation.

  • Store extracts in amber vials to prevent light oxidation.

  • Use nitrogen overlay before sealing.

  • Maintain –80 °C for long-term storage.

  • Avoid repeated freeze–thaw cycles.

These storage guidelines align with CDC Laboratory Quality Practices and NIST metabolomics stability studies.

https://affigen.com/fr-fr/collections/affiextract

Advantages of Modern Lipid Extraction Kits

  • High reproducibility: Controlled reagent composition ensures consistent extraction efficiency.

  • Safety: Chloroform-free formulations reduce toxicity.

  • Versatility: Compatible with diverse matrices — blood, liver, cell cultures, plant tissues.

  • Speed: Extract 20–50 samples per hour in parallel.

  • Scalability: Suitable for micro-scale and large-volume extractions.

  • Analytical compatibility: Clean extracts ready for LC-MS, GC-MS, TLC, or colorimetric assays.

Several academic institutions such as MIT Department of Biology and Stanford University Biochemistry highlight standardized lipid extraction as essential for reproducible metabolic research.

Challenges and Future Developments

Even with kits, some challenges persist:

  • Differential extraction bias: Certain lipids like lysophospholipids or oxidized species may recover poorly.

  • Solvent waste management: Labs must comply with environmental regulations for solvent disposal (EPA Hazardous Waste Guidelines).

  • Automation: Integration with robotic liquid handlers is under development for fully automated lipid extraction pipelines.

  • Green chemistry: Research is ongoing toward ethanol-based or ionic-liquid extraction systems that are environmentally friendly (DOE Green Chemistry Program).

 Example Product Features – AffiEXTRACT® Lipid Extraction Kit (Affigen)

  • Ready-to-use reagents (no solvent preparation required).

  • Suitable for cells, plasma, serum, or tissue homogenates.

  • Recovers total lipids for colorimetric or LC-MS analysis.

  • Yields consistent extraction efficiency across major lipid classes.

  • Safer, non-chlorinated solvents compliant with EU and U.S. laboratory standards.

  • Includes detailed protocol and high-purity extraction buffers.

  • Manufactured under ISO-certified processes.

Learn more at Affigen Lipid Extraction Kits.

Conclusion

The Lipid Extraction Kit represents a significant advancement in lipidomics sample preparation. By offering high reproducibility, operator safety, and cross-platform compatibility, it allows researchers to generate reliable lipid profiles essential for modern biological and biochemical studies.

Implementing a standardized extraction kit supports compliance with QA/QC standards recommended by NIST, NIH, EPA, and FDA, while improving throughput and analytical accuracy.

In modern laboratories, whether academic, clinical, or industrial, integrating a lipid extraction kit into your workflow ensures better data quality, reduced variability, and faster experimental turnaround — ultimately driving progress in lipid metabolism research, biochemistry, and biotechnology.
Recombinant Human GM-CSF: Technical Review, Structural Biology, and Applications in Immunology and Hematopoiesis

Introduction

Granulocyte-Macrophage Colony-Stimulating Factor (GM-CSF) is a key hematopoietic cytokine responsible for the proliferation and differentiation of myeloid progenitor cells into granulocytes, macrophages, and dendritic cells. In humans, it is encoded by the CSF2 gene located on chromosome 5q31.1 (ncbi.nlm.nih.gov).

Recombinant Human GM-CSF (rhGM-CSF) has become a critical reagent in immunology, stem cell research, and cell therapy. It is widely used for in vitro culture of myeloid lineages, generation of monocyte-derived dendritic cells (moDCs), and stimulation of progenitor expansion in both primary hematopoietic cultures and cell-line systems such as TF-1 or HL-60.

This article provides a technical overview of GM-CSF molecular biology, protein structure, manufacturing characteristics, bioassay validation, research applications, and SEO-optimized keywords for improved online discoverability.

AffiREC® Molgramostim: Recombinant Human GM-CSF

Molecular Biology of GM-CSF

 Gene and transcriptional regulation

The human CSF2 gene is a 2.8 kb segment located on chromosome 5, closely associated with the IL-3 and IL-5 loci (ncbi.nlm.nih.gov). Its transcription is regulated by NF-κB, AP-1, and CREB binding motifs responding to inflammatory signals such as TNF-α, IL-1β, and LPS (pubmed.ncbi.nlm.nih.gov).

Expression occurs in T lymphocytes, macrophages, endothelial cells, fibroblasts, and airway epithelial cells, particularly during immune activation and tissue injury (genome.gov).

 Protein structure

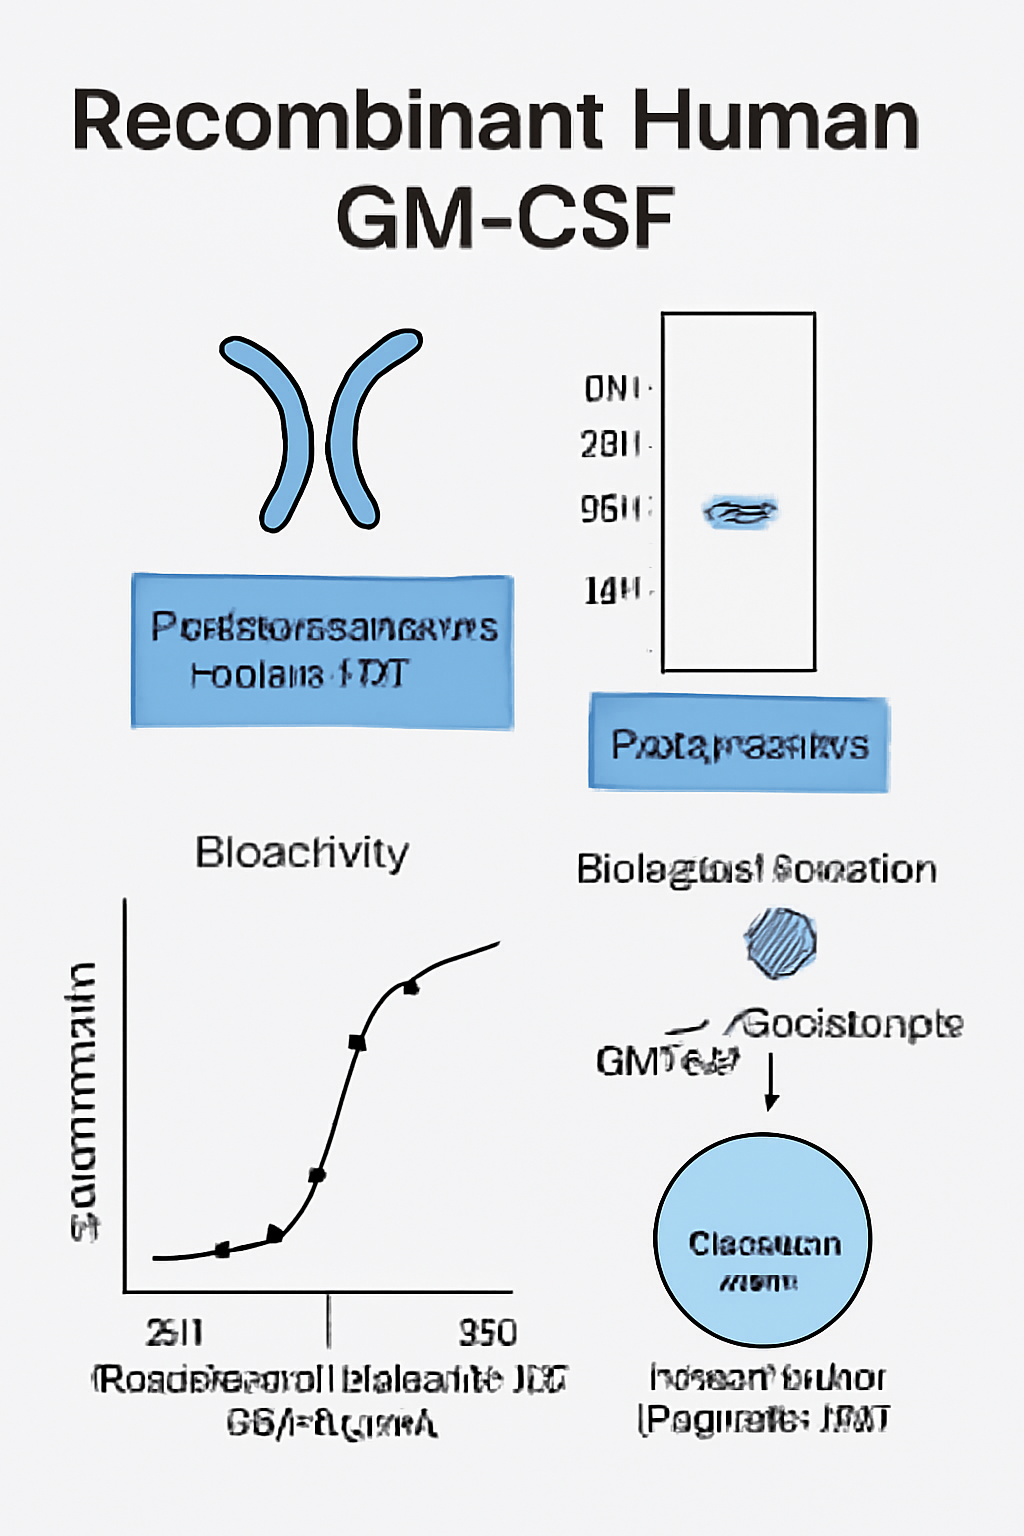
GM-CSF is a monomeric glycoprotein (~14–32 kDa depending on glycosylation), consisting of 127 amino acids with two conserved disulfide bonds. The crystal structure shows a four-α-helix bundle typical of class I cytokines (rcsb.org).

Recombinant GM-CSF expressed in E. coli is usually non-glycosylated (~14.6 kDa), while mammalian expression systems (e.g., CHO, HEK293) produce glycosylated variants (~23 kDa). Both retain biological activity through conserved cysteine folding (pnas.org).

 Receptor and signalling cascade

The GM-CSF receptor (GM-CSFR) is a heterodimeric complex comprising an α-chain (CD116) and a common β-chain (CD131), the latter shared with IL-3 and IL-5 receptors (ncbi.nlm.nih.gov).

Upon ligand binding, the receptor activates JAK2, leading to phosphorylation of STAT5, MAPK/ERK, and PI3K/AKT pathways. These pathways promote progenitor survival, myeloid differentiation, and immune activation (pubmed.ncbi.nlm.nih.gov).

Expression, Purification and Quality Control of Recombinant GM-CSF

 Expression systems

Most recombinant human GM-CSF available for research is expressed in E. coli, yeast (Pichia pastoris), or mammalian systems (CHO or HEK293).

  • E. coli expression yields high purity and activity but lacks glycosylation.

  • Mammalian expression maintains proper folding and glycosylation, improving serum half-life and stability.

  • Yeast expression offers cost efficiency and post-translational modifications similar to mammalian proteins.

Each batch undergoes analytical validation such as SDS-PAGE, mass spectrometry, and RP-HPLC purity assessment (nist.gov).

 Purification and refolding

Purification employs ion-exchange chromatography, gel filtration, or affinity tags (His, GST), followed by oxidative refolding to restore disulfide linkages (nih.gov).

 Quality attributes

Parameter Typical Specification
Purity > 95% by SDS-PAGE
Endotoxin level < 1 EU/µg protein (LAL method)
Activity ED₅₀ = 5–30 pg/mL (TF-1 assay)
Formulation Lyophilized, PBS + carrier
Storage –20 °C / –80 °C long-term
Reconstitution 0.1% BSA + sterile H₂O, aliquot to avoid freeze–thaw

All these parameters should be verified via lot-specific Certificate of Analysis (CoA) for reproducibility and regulatory compliance (fda.gov).

Bioassay Validation and Functional Testing

The biological potency of recombinant GM-CSF is validated by cell-based proliferation or differentiation assays, most commonly using the human TF-1 cell line, a GM-CSF-dependent erythroleukemia cell line (atcc.org).

 Proliferation assay

  • Assay principle: rhGM-CSF induces TF-1 proliferation proportional to concentration.

  • Readout: colorimetric or luminescent detection of viable cells after 72 h.

  • Reference range: ED₅₀ = 5–30 pg/mL under standard culture conditions.

 Differentiation assays

GM-CSF triggers monocyte-to-macrophage or monocyte-to-dendritic-cell differentiation when combined with IL-4 or M-CSF. Cells are phenotyped by CD11c, CD14, HLA-DR, and CD86 expression via flow cytometry (nih.gov).

 Cytokine synergy testing

Co-culture studies assess GM-CSF’s synergy with IL-3, IL-5, TNF-α and IFN-γ in modulating myeloid activation and polarization (frontiersin.org).

Recombinant GM-CSF in Research Applications

 Hematopoietic stem cell and progenitor culture

rhGM-CSF is indispensable for expanding CD34⁺ HSPCs from cord blood or bone marrow. It supports myeloid progenitor survival and proliferation in combination with SCF and IL-3 (nih.gov).

 Monocyte-derived dendritic cell differentiation

The classical method for generating human dendritic cells in vitro employs GM-CSF + IL-4 treatment of peripheral blood monocytes for 5–7 days. The resulting CD11c⁺ HLA-DR⁺ cells exhibit antigen presentation and co-stimulatory capacity (harvard.edu).

 Myeloid cell activation and macrophage polarization

GM-CSF biases macrophages toward an M1-like pro-inflammatory phenotype, increasing expression of CD86, IL-12, and TNF-α, contrasting with M-CSF-induced M2-like macrophages (nih.gov).

 Cancer and tumour immunology

The CSF2/GM-CSF axis modulates the tumour microenvironment (TME) by recruiting and activating tumour-associated macrophages (TAMs) and dendritic cells. Some cancers secrete GM-CSF to drive immune suppression or angiogenesis (cancer.gov).

Conversely, exogenous GM-CSF is used in cancer vaccines to enhance antigen presentation, as in GVAX (GM-CSF-secreting tumour cell vaccine) trials (clinicaltrials.gov).

 Inflammatory and autoimmune disorders

GM-CSF contributes to neuroinflammation, arthritis, and lung alveolar proteinosis. Elevated GM-CSF is associated with multiple sclerosis lesions and rheumatoid arthritis synovial fluid (nih.gov). Recombinant GM-CSF is used as a research tool in modelling these immune processes.

 Cell therapy and regenerative medicine

In ex-vivo cell therapy protocols, GM-CSF is applied for myeloid-cell enrichment and monocyte activation before adoptive transfer. It is also used to mobilize progenitors in hematopoietic transplant conditioning (fda.gov).

Handling, Storage, and Technical Best Practices

Parameter Recommended practice
Reconstitution Dissolve lyophilized GM-CSF in sterile water + 0.1% BSA to ≥ 10 µg/mL
Aliquoting Divide into small volumes to avoid repeated freeze/thaw
Storage −20 °C (short term), −80 °C (long term); avoid frost-free freezers
Sterility Filter (0.22 µm) before culture addition
Working concentration 10–100 ng/mL typical for monocyte/DC cultures
Compatibility Avoid combination with reducing agents or detergents

All protocols should reference supplier technical datasheets and follow institutional biosafety guidelines (osha.gov).

Emerging Research Directions

GM-CSF in neuroimmunology

Recent studies show GM-CSF’s role in microglial activation and neuroprotection in spinal cord injury models (nih.gov). Recombinant protein treatments have been shown to promote axonal regeneration and reduce demyelination in experimental settings.

 GM-CSF and host defense

GM-CSF enhances alveolar macrophage maturation and pathogen clearance against bacterial and fungal infections such as Listeria monocytogenes and Aspergillus fumigatus (cdc.gov).

 Bioengineering applications

Recombinant human GM-CSF is being integrated into microfluidic co-culture systems and 3D organoid models to recreate physiological myeloid niches (nih.gov).

SEO-Optimized Keywords and Metadata Recommendations

For website or catalogue publication, the following keywords and tags should be integrated in meta-title, meta-description, headings, and alt-image text:

Primary Keywords:

  • recombinant human GM-CSF

  • rhGM-CSF protein

  • GM-CSF cytokine human

  • granulocyte-macrophage colony-stimulating factor recombinant

  • myeloid differentiation cytokine

  • dendritic cell generation GM-CSF

Secondary / Long-tail Keywords:

  • CSF2 cytokine human research reagent

  • recombinant GM-CSF for immune cell culture

  • macrophage activation cytokine GM-CSF

  • hematopoietic progenitor expansion factor

  • human GM-CSF ELISA standard

  • GM-CSF receptor signalling pathway

Meta Description (example):

Recombinant Human GM-CSF (CSF2) — active cytokine for myeloid differentiation, dendritic cell generation, and hematopoietic research. > 95% purity, validated in TF-1 bioassay.

Summary

Recombinant Human GM-CSF (CSF2) remains an indispensable cytokine for research and therapeutic development. Its broad biological functions—from stem cell regulation to immune activation—make it a critical reagent for laboratories investigating hematopoiesis, immunology, oncology, and regenerative biology.

A high-quality recombinant GM-CSF should provide:

  • confirmed sequence and bioactivity,

  • purity > 95% (SDS-PAGE validated),

  • low endotoxin (< 1 EU/µg),

  • validated use in cellular assays,

  • comprehensive datasheet documentation,

  • stability under recommended storage.

Technical Overview of the Rabbit Polyclonal Anti-Serotonin (5-HT) Antibody

In contemporary neuroscience, gastrointestinal, endocrine and oncological research, the neurotransmitter Serotonin (5-hydroxytryptamine, 5-HT) plays a central role in both physiological signalling and pathology. A robust reagent to detect serotonin content within cells or tissues is the rabbit polyclonal anti-5-HT antibody (often described as “anti-5-HT (serotonin) rabbit polyclonal antibody”) which facilitates immunohistochemistry (IHC), immunofluorescence (IF), immunocytochemistry (ICC) and sometimes quantitative immunoassays.

Below we cover target biology, antibody-selection parameters, protocol considerations, validation and quality control, research applications, troubleshooting, and recommended keyword integration for SEO and indexing.

Target Biology: Serotonin (5-HT) in DetailBiosynthesis, storage, and distribution

Serotonin (5-HT) is synthesised primarily from the amino acid L-tryptophan via the enzymes tryptophan hydroxylase (TPH) and aromatic L-amino acid decarboxylase. Its distribution includes a substantial peripheral pool (notably in enterochromaffin (EC) cells of the gastrointestinal (GI) tract) as well as central nervous system (CNS) serotonergic neurons (for instance the raphe nuclei) and platelet stores. A widely cited review describes how “most serotonin is found outside the CNS” and how nearly all 15 serotonin receptor subtypes have both central and peripheral expression. cdr.lib.unc.edu+2bionumbers.hms.harvard.edu+2
In the GI tract, EC cells are the dominant source of 5-HT; studies estimate ~90–95% of the body’s serotonin is produced in the gut. diposit.ub.edu

Receptor systems & signalling

Serotonin exerts its functions via a diverse family of receptors (5-HT1 through 5-HT7, with ~15 known sub-types) that are primarily G protein-coupled receptors (GPCRs), except for the 5-HT₃ ligand-gated ion channel. wiki.ostrowonline.usc.edu+1
These receptors regulate a vast array of physiological processes: mood regulation, sleep, appetite, gastrointestinal motility, platelet aggregation, vascular tone, and immune cell responses. For example, the “expanded serotonin biology” review outlines regulation of cardiovascular, pulmonary, GI, genitourinary and CNS systems. cdr.lib.unc.edu+1

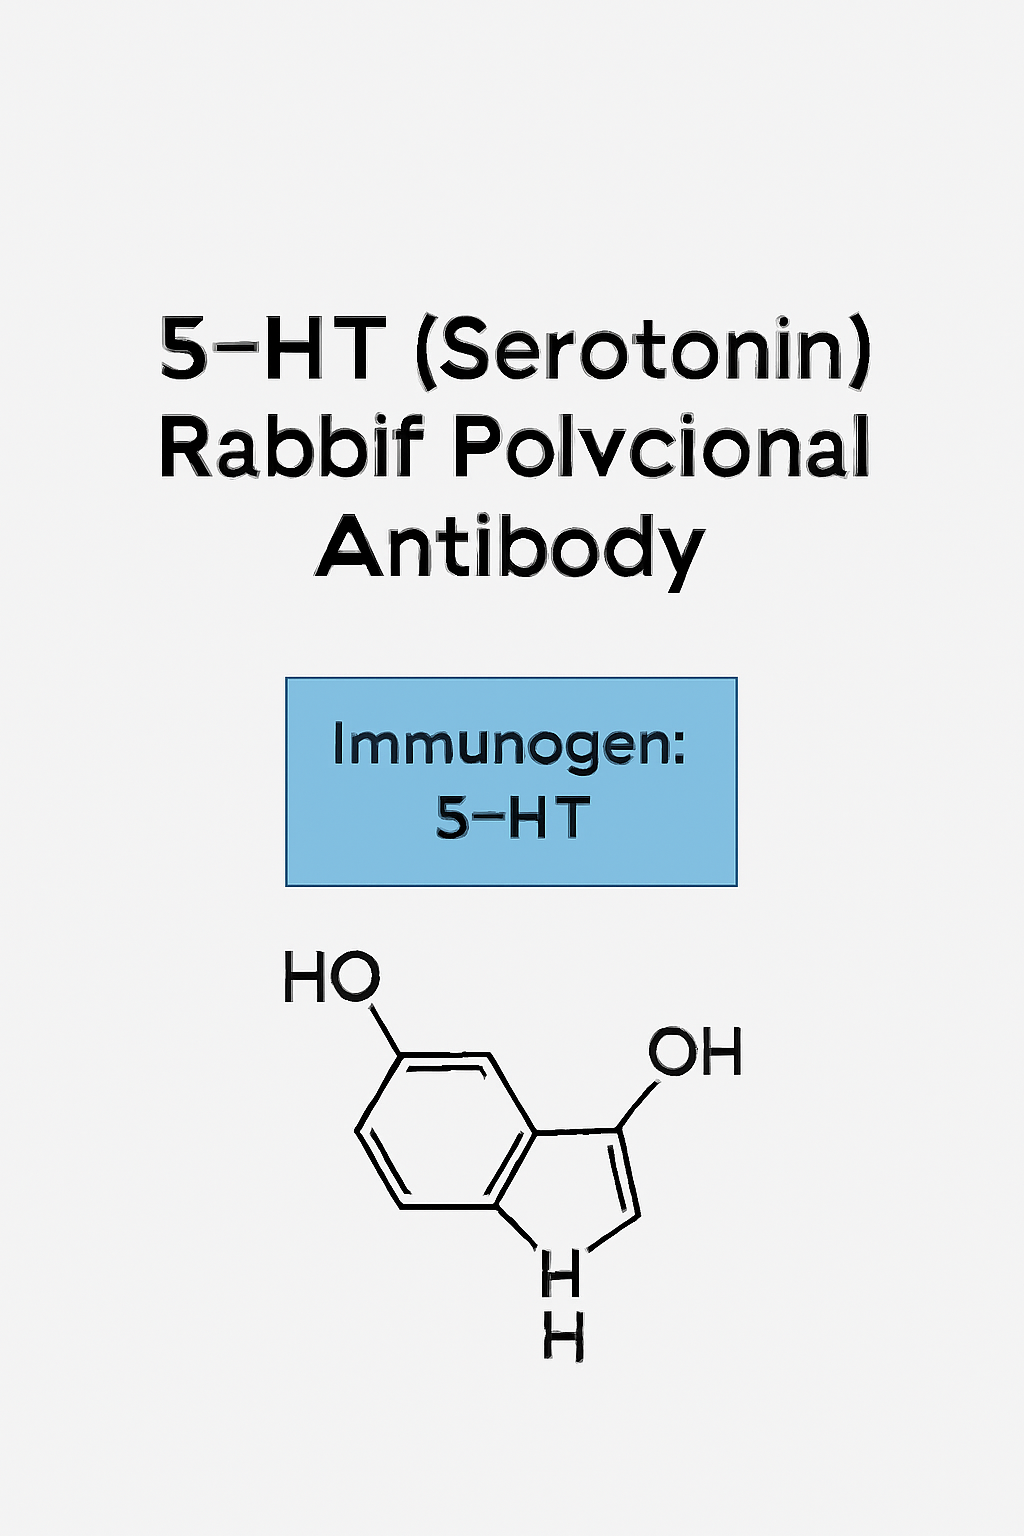
AffiNEURO® 5-HT (Serotonin) Rabbit Polyclonal Antibody

Pathophysiological relevance

Aberrant serotonergic signalling is implicated in multiple disorders: mood disorders (depression, anxiety), GI disorders (irritable bowel syndrome), neurodegenerative and developmental disorders, carcinoid tumours (serotonin-producing), and emerging evidence in oncology and immunology (for example, serotonin transporter expression modulating tumour immunity). Cell+1

Given the wide physiological relevance and diverse tissue distribution of serotonin, accurate immunodetection of 5-HT is of high research value.

Choosing a Rabbit Polyclonal Anti-5-HT (Serotonin) Antibody

When selecting a rabbit polyclonal antibody against serotonin (i.e., a reagent raised in rabbit, polyclonal IgG fraction recognising serotonin or a serotonin-carrier conjugate), key technical parameters should be evaluated:

Host species & clonality

  • Host: Rabbit. Rabbits are preferred for polyclonal antibodies because they generate high titres and diverse epitope recognition.

  • Polyclonal nature: The polyclonal format recognises multiple epitopes around the immunogen, beneficial for sensitivity (detection of low‐abundance antigen) but potentially less specific than highly characterised monoclonals.

  • It is critical that the datasheet clearly states “rabbit whole antiserum” or “rabbit IgG fraction” and provides clone/lot information. For example: the Sigma product “Anti-Serotonin antibody produced in rabbit whole antiserum”. sigmaaldrich.com

Immunogen specificity

  • The immunogen typically is serotonin (5-HT) conjugated to a protein carrier (e.g., BSA, thyroglobulin) or formaldehyde-linked to a carrier.

  • The manufacturer should provide cross-reactivity data: ideally minimal or no cross‐reactivity with structurally similar molecules such as 5‐hydroxytryptophan, tryptamine, melatonin, 5-HIAA, etc. For example, one antibody datasheet states “did not show any significant cross reactivity with 5-Hydroxytryptamine analogs, including Tryptamine and 5-Methoxytryptamine.”

  • When purchasing for high specificity applications (e.g., tumour immunophenotyping, quantification of EC cells), ensure immunogen and cross‐reactivity data are clearly listed.

Purification & format

  • The antibody may be supplied as whole serum, affinity-purified IgG, or as a fractionated IgG.

  • Buffer formulation, preservatives (e.g., sodium azide), and storage conditions should be specified. For example the Sigma product states: “supplied as a liquid containing 15 mM sodium azide as preservative.” sigmaaldrich.com

  • If using in quantitative immunoassays or multiplex panels, affinity-purified formats are preferred to reduce background.

Applications & validated use

  • The datasheet should list validated applications (IHC-P: immunohistochemistry on paraffin, IHC-Fr: frozen, IF: immunofluorescence, ICC: immunocytochemistry) and recommended dilutions.

  • Example: Sigma states performance in rat brain perfusion-fixed frozen sections and human appendix paraffin sections. sigmaaldrich.com

  • Example: Abcam lists validation for IHC-P and IHC-Fr for their anti-Serotonin antibody. abcam.com

  • When selecting your reagent, compile a list of peer-reviewed citations (evidence of reproducible use).

Species reactivity & tissue specificity

  • Confirm that the antibody is reactive with the species and tissue of interest (mouse, rat, human, non-human primate, etc.).

  • Confirm that localisation matches known serotonin distribution (e.g., serotonergic fibres in brainstem, EC cells in gut, platelets). Example: “reacts with serotonin-containing fibres in perfusion-fixed, free-floating sections of rat brain” and “specifically stains enterochromaffin cells in … human appendix …” sigmaaldrich.com

  • Avoid antibodies with known non-specific staining in unrelated tissues unless thoroughly validated.

Data & documentation

  • Request Certificate of Analysis (CoA), lot‐specific datasheet, validation images, and references to peer-reviewed publications.

  • For regulatory or compliance purposes (e.g., GLP labs, core facility accreditation), retain documentation of storage, transport (e.g., dry-ice shipping), and handling.

  • Document unwanted cross-reactivity or background in your specific experimental context.

Storage and handling

  • Follow the manufacturer’s recommended storage: often 2-8 °C short term (<1 month) and −20 °C or −80 °C for longer term. Example: “store at 2-8 °C for up to one month; for extended storage freeze in working aliquots; repeated freezing/thawing not recommended.” sigmaaldrich.com

  • Avoid “frost-free” freezers for long-term storage because of temperature fluctuations.

  • Aliquot to avoid repeated freeze/thaw cycles which degrade antibody performance.


Protocol Implementation & Best Practices

When implementing the rabbit polyclonal anti-5-HT antibody in your lab workflow (whether IHC, IF or ICC), follow these recommended best practices for maximal specificity and reproducibility.

Tissue preparation & antigen retrieval

  • For paraffin embedded tissue (IHC-P): perform deparaffinisation, rehydration, and heat-mediated antigen retrieval (e.g., citrate pH 6.0 or EDTA pH 8.0) as per the datasheet. For example, some users apply sodium citrate buffer retrieval for 20 minutes. abcam.com

  • For frozen sections: perfusion-fixed animals (e.g., rat brain) may be fixed in paraformaldehyde, cryoprotected, sectioned, and blocked before primary. Examples include rat brain perfusion fixation. sigmaaldrich.com

  • Use appropriate blocking buffers (serum of host species of secondary, BSA, fish gelatin, etc.) to minimise non-specific binding.

Primary antibody dilution and incubation

  • Begin with manufacturer recommended dilutions (for example IHC-P: 1:200-1:400, IF: 1:50-1:200).

  • Titrate the antibody for your specific tissue, fixation method and detection system (HRP/DAB versus fluorescence).

  • Incubation time and temperature (e.g., overnight at 4 °C or 1 h at RT) may need optimisation depending on antigen abundance and background.

Secondary detection & signal amplification

  • Use high quality secondary antibodies (e.g., anti-rabbit IgG conjugated to HRP or fluorescence dyes) that are cross-adsorbed to minimise cross-reactivity.

  • For high sensitivity, consider amplification systems (e.g., biotin–streptavidin–HRP, tyramide signal amplification) especially in tissues where serotonin is low.

  • If applying multiplex immunofluorescence (e.g., co-labelling serotonin with other markers), ensure compatibility of fluorophores and check for spectral overlap.

Controls & specificity testing

  • Essential controls:

    • Negative control: omit primary antibody, only include secondary.

    • Isotype/secondary only control: for polyclonal antibodies, consider using pre-immune serum or IgG control.

    • Absorption/competition control: pre-incubate antibody with excess serotonin–BSA conjugate to confirm staining is abolished (if suggested by vendor).

    • Positive control tissue: e.g., human appendix EC cells, known serotonin fibres in rat brain.

  • Document background staining, non-specific binding, and ensure signal corresponds to known serotonin localisation (e.g., EC cells, raphe nucleus fibres, platelets).

Imaging and quantification

  • For IHC: obtain high-resolution images, record microscope settings, maintain consistent exposure. Quantify using image-analysis software (e.g., ImageJ, QuPath) when comparing conditions.

  • For IF: keep exposure times consistent across samples; include no-primary and no-secondary controls.

  • For quantification: ensure linear signal range, avoid saturation, include calibration controls if needed (e.g., tissue microarrays).

  • Record metadata (tissue type, fixation protocol, antigen retrieval, antibody lot, dilution, incubation time, detection system) for reproducibility.

Troubleshooting common issues

  • High background: reduce primary antibody concentration, increase blocking time, check secondary specificity, increase washing stringency.

  • Weak or no signal: increase primary antibody concentration, extend incubation time, verify antigen retrieval, check tissue fixation (overfixation may mask antigen).

  • Non-specific signal in unexpected cells: verify cell type expression of serotonin in literature, consider alternate antibody or further blocking, perform absorption control.

  • Lot-to-lot variability: maintain aliquots of proven working lot, document performance, evaluate new lots with a small pilot.

Research Applications of Anti-5-HT (Serotonin) Rabbit Polyclonal Antibody

Neuroscience & serotonergic system mapping

One of the most common usages: mapping serotonergic neurones and their projection fibres in the brain, spinal cord, and peripheral nervous system. The antibody can visualise serotonergic cell bodies (e.g., raphe nuclei), dendrites and terminals in downstream regions (e.g., cortex, hippocampus) as well as quantify changes in neurodevelopmental, injury or disease models. Example: rat brain perfusion-fixed sections stained for serotonin showing distinct fibre networks. abcam.com
Such mapping supports studies of mood regulation, sleep/wake cycles, pain modulation, neurodegeneration and regenerative neuroscience.

Gastrointestinal (GI) system / enterochromaffin cell studies

Because EC cells in the gut are major serotonin sources, the antibody is used to identify and quantify EC cells, measure serotonin release in gut wall, and study gut–brain axis mechanisms (e.g., serotonin from EC cells modulating vagal afferents). The review of whole-body homeostasis by Franco et al. describes the peripheral serotonin role in GI motility and immune modulation. diposit.ub.edu
Researchers may assess EC cell density, serotonin content changes in models of irritable bowel syndrome (IBS), inflammatory bowel disease (IBD), GI motility disorders, or microbiome-serotonin interactions.

Oncology / carcinoid and neuroendocrine tumour research

Certain neuroendocrine tumours (carcinoids) secrete serotonin; therefore, immunohistochemistry using anti-5-HT antibody helps identify serotonin-producing tumour cells for diagnostic pathology or research. For example, staining of human appendix sections for EC cells and serotonin-positive tumours has been documented. sigmaaldrich.com
It also supports studies of serotonin’s role in tumour microenvironment, tumour signalling and metastasis (e.g., the serotonin transporter’s role in antitumor immunity). Cell

Platelet, vascular and cardiovascular research

Serotonin released from platelets plays roles in vascular tone, hemostasis, thrombosis and cardiovascular pathology. Investigators may use anti-5-HT antibody to detect serotonin in platelet preparations, vascular tissue sections (e.g., internal vessel wall, atherosclerotic lesions) or investigate platelet–serotonin signalling. The review by Gershon outlines such peripheral functions. bionumbers.hms.harvard.edu

Neurodevelopment, neuropsychiatric & behaviour studies

Serotonin plays key roles in brain development, synaptogenesis, plasticity, and behaviour (e.g., mood, aggression, social behaviour). Researchers may use anti-5-HT antibody for quantifying serotonin levels in developmental animal brains, comparing wild-type vs knockout models, or assessing brain regions in autism spectrum disorder, depression models etc. Janušonis & Kern analysed platelet serotonin distributions in autism using immunochemical methods. labs.psych.ucsb.edu

Immune system & gut-brain-immune axis

Emerging research indicates serotonin modulates immune cell responses (e.g., dendritic cells express serotonin receptors and respond to 5-HT signalling). The antibody may be used in immunohistochemical studies of immune organs, gut mucosa, or inflammatory lesions to localise serotonin in immune microenvironment niches. diposit.ub.edu

Bench and Compliance Considerations for Industry and Research-Grade Use

Given the user’s context (biotechnology products, supply documentation, marketing materials, compliance), here are key operational steps and documentation requirements when integrating the rabbit polyclonal anti-5-HT antibody into your product catalogue or research offering.

Documentation & supplier-datasheet review

  • Ensure the supplier provides a full datasheet: immunogen description, host species, clonality, purity, validated applications, reactivity species list, recommended dilutions, buffer composition, preservative (e.g., sodium azide), shipping/storage requirements (e.g., dry ice, 2-8 °C short term, −20/−80 °C long term).

  • Verify the certificate of analysis (CoA) for the specific lot you receive; compare key parameters such as titre, binding specificity, cross-reactivity, endotoxin (if relevant), sterility (if relevant).

  • For compliance, document shipping chain (e.g., dry‐ice manifest), storage logs (e.g., −80 °C inventory file), and in-house validation data (e.g., positive control tissue runs, negative controls, lot switch verification).

  • Align with your product naming conventions (e.g., AffiAB® Anti-5-HT (Serotonin) Rabbit Polyclonal Antibody (Clone: [if clone specified])) and ensure datasheet formats (units µL, °C, etc) comply with your formatting preferences.

Packaging, shipping & storage logistics

  • Label “Store at –20 °C” (or as per vendor) with “Avoid repeated freeze/thaw cycles” warning.

  • Use cold chain shipping: e.g., dry ice for antibody aliquots; note if stored at 2-8 °C short term only.

  • Provide marketing materials: high-resolution images of IHC staining (e.g., human appendix EC cells, rat brain raphe nucleus fibres), technical bullet points (host species rabbit, polyclonal IgG, validated IHC/IF, minimal cross-reactivity).

  • Include possible contraindications: e.g., “Not cross-reactive with 5-HIAA, melatonin, GABA, noradrenaline” (if stated by vendor) and definitions of “pre-blocked” usage.

Quality assurance & performance verification

  • Run an in-house pilot on known positive tissue (e.g., human appendix or rat raphe brain) to confirm antibody performance.

  • Document dilution range: e.g., start at 1:200 for IHC-P, adjust ±2-fold based on signal/background; record images and microscopy settings.

  • For each new lot, perform side-by-side comparison with previous lot to assess staining intensity, background and specificity; maintain internal lot-tracking log.

  • Ensure compatibility with your detection system (HRP/DAB or fluorescence) used in your customers’ labs; provide recommended protocols and troubleshooting tips.

Marketing & SEO material

  • Generate datasheet PDF with keywords: “5-HT rabbit polyclonal antibody”, “serotonin immunostaining”, “serotonergic fibre detection”, “enterochromaffin cell serotonin detection”, “serotonin immunohistochemistry research”, “neuroscience serotonin antibody”, “gut-brain axis serotonin antibody”, “platelet serotonin immunodetection”.

  • On your website or catalogue page, create deep content (e.g., this article) with internal links, alt‐text images (“IHC human appendix serotonin EC cells”), meta description (“Rab­bit poly­clonal anti-5-HT seri­ton­in anti­body for IHC/IF – validated for human, rat, mouse tissues”) and structured data (product schema) as per your style.

  • For blog posts or supplier pages, embed the article’s sections as H2/H3 headings, internal links (to your other neuroscience/GI/antibody product pages) and external authoritative links (as in this article) to boost SEO authority.


Extended Technical Notes: Specific Use-Cases & Advanced Considerations

Quantitative immunochemistry & image analysis

When the research goal is quantification (e.g., counting EC cells per mm² in gut mucosa, measuring serotonin fibre length/density in brain sections), the following advanced steps apply:

  • Use digital pathology software (e.g., QuPath) to segment serotonin-positive cells or fibres. Establish thresholding based on negative control from same run.

  • Validate linearity: treat tissues with known manipulations (e.g., serotonin depletion model, knockout of TPH1/TPH2) to assess dynamic range.

  • Co-staining approaches: e.g., serotonin + chromogranin A to confirm EC cell identity, or serotonin + SERT (serotonin transporter) for fibre/axon identification.

  • Report metrics such as % area positive, average staining intensity, fibre length/mm², cell count per µm², standard deviation, and include negative/positive controls.

  • In multi-site studies, ensure standardised fixation, antigen retrieval, scanner calibration, and image analysis pipeline to reduce inter-site variability.

Cross-reactivity and specificity in multiplex panels

  • When integrating into multiplex immunofluorescence (e.g., serotonin + dopamine transporter + GABA), verify that the rabbit polyclonal anti-5-HT does not cross‐react with other aminergic systems or with detection reagents used for other targets.

  • Consider spectral spill-over controls and compensation if using fluorescent secondaries.

  • For dual-labelling with another rabbit primary, consider conjugating the anti-5-HT to a different host or using subclass-specific secondary to avoid cross-reactivity.

Validation for regulatory or GLP settings

  • If the antibody is used in a GLP/non-GLP regulated assay (e.g., biomarker immunostaining for clinical study), document lot qualification, specificity via absorption/competition, reproducibility across ≥3 runs, stability under storage conditions, and acceptance criteria (signal-to-noise ratio, coefficient of variation).

  • Maintain traceability: supplier lot number, expiry date, usage log, aliquot records, freezer inventory.

  • For reagent inclusions in kits or product bundles, include safety data sheet (SDS), storage conditions, handling instructions, lot release testing certificate, and any available peer-reviewed application citations.

Emerging applications & cutting-edge research

  • Advances in genetically-encoded serotonin sensors (e.g., sDarken) allow real-time imaging of 5-HT dynamics. catalog.library.vanderbilt.edu While not a substitute for immunostaining, these tools complement static antibody-based assays and may be used in tandem in research programmes.

  • Structural studies: For example, the extracellular recognition of the human 5-HT2B receptor via antibody Fab fragment provides insight into receptor-ligand interactions. PNAS

  • Immune oncology: serotonin transporter modulation in tumour-immune context (e.g., CD8 T cell activation) is an emerging field. Cell These developments increase the demand for well-characterised serotonin antibodies for translational research.

Summary & Key Take-Home Points

  • Serotonin (5-HT) is a critical neurotransmitter/hormone with broad systemic roles (CNS, GI tract, cardiovascular, immune).

  • A high-quality rabbit polyclonal anti-5-HT (serotonin) antibody is a vital reagent for immunohistochemical/fluorescent detection of serotonin in diverse tissues.

  • When selecting this reagent, prioritise: host species (rabbit), clonality (polyclonal), immunogen specificity, validated applications, reactivity with desired species/tissues, supporting data (CoA, publications), and appropriate storage/handling.

  • Protocol optimisation (fixation, antigen retrieval, dilution, detection system) and rigorous controls (negative, absorption, positive tissue) are mandatory to ensure specific, reproducible results.

  • Extended applications include neuroscience mapping, gastrointestinal EC cell studies, oncology/neuroendocrine tumour research, platelet/vascular investigations, and emerging immune-serotonin crosstalk work.

  • From a commercial/marketing perspective, deep technical content, strongest SEO-friendly keywords, authoritative hyperlinks, and full compliance documentation enhance product visibility and trust.

  • For your branding and catalogue (e.g., AffiAB® Anti-5-HT (Serotonin) Rabbit Polyclonal Antibody) ensure consistent naming, datasheet formatting (units, storage instructions), marketing materials, images, and technical bullet-points aligned with this article content.

Structural and Functional Mapping of Transporter Using Antibody Tools

Overview: why ABCC1 (MRP1) matters

The ABCC1 gene encodes MRP1, a multispecific ATP-binding cassette (ABC) exporter that effluxes glutathione conjugates, leukotrienes, xenobiotics, and many anticancer drugs. Gene and locus details: NCBI Gene—ABCC1. For the ABC transporter superfamily background, see the classic NCBI Bookshelf overviews (ABC superfamily; transport in “The Cell”). Mechanistic and disease context for ABC drug transporters is reviewed in open-access literature (cryo-EM review of multidrug transporters). CNIB+2CNIB+2PMC

Domain architecture to target with antibodies

ABCC1/MRP1 contains three membrane-spanning domains (MSD0, MSD1, MSD2) and two cytosolic nucleotide-binding domains (NBD1, NBD2). An extra N-terminal MSD0 plus a long cytosolic L0 linker is characteristic of several ABCC subfamily members and modulates trafficking and activity. Antibody strategies often focus on extracellular loops (ECLs) from MSD0/1/2 and conformational epitopes that report inward- versus outward-facing states. Structural and biochemical support for MSD0/L0: yeast ABCC homolog Ycf1p (TMD0/L0 defined), and human MRP1 studies that established the L0 linkage to the core transporter. See primary resources: Ycf1p TMD0/L0, linker domain review, MRP1 TMD0→TMD1 loop ~120 aa, and an MRP1 domain schematic highlighting MSD0 and CL/L0 (open-access figure). For gene-level context across ABCs, see the Bookshelf human ABC gene table (Table—human ABC genes). PMC+3PMC+3PMC+3CNIB

Conformational cycle and structural frames of reference

Cryo-EM and mechanistic analyses support a transport cycle with NBD association/dissociation coupled to large-scale TMD rearrangements. For MRP1/ABCC1, cryo-EM and kinetic studies capture key post-hydrolysis states and substrate-bound conformations. See: cycle and NBD motions (kinetic/cycle analysis) and broader multidrug transporter structural insights (review). These frames let you place conformation-sensitive antibodies (Fab fragments, conformation-specific mAbs) to report inward-open vs. outward-open ensembles or to “trap” functional intermediates during substrate or ATP binding. PMC+1

Substrate recognition landmarks that guide epitope placement

ABCC1 transports amphipathic organic anions, notably leukotriene C4 (LTC4) and many GSH conjugates. Mapping antibodies near ECLs that line the bipartite LTC4 site can yield functional readouts (competition, transport inhibition, conformational shifts). For chemical references: PubChem—LTC4. Structure/biochemistry papers delineate the LTC4 pockets and NBD coupling (e.g., Conseil et al. 2019; Payen et al. 2005—PubMed entries). PubChemPubMed+1

AffiAB®​ MRP1 / ABCC1 (Multidrug Resistance Related Protein 1) (MRP1/1343), 1mg/mL Antibody

Antibody toolbox for structural and functional mapping

1) Conformation-sensitive antibodies (native epitopes)

  • Goal: Distinguish inward-open vs outward-open states or ATP-bound/post-hydrolysis states via differential epitope exposure on ECLs.

  • Approach: Generate or select mAbs on proteoliposome-reconstituted ABCC1 or cells overexpressing ABCC1, screen binding in the presence/absence of ATP, vanadate, or substrate analogs. Stabilize small/heterogeneous particles with Fab fragments for structural work. Methodological background on Fab-assisted cryo-EM and small target augmentation: Fabs enable single-particle cryo-EM; recent overviews on antibody/sybody-aided EM: 2023 transporter review, 2025 rigid-enlargement strategy. PMC+2PMC+2

2) Extracellular loop (ECL) epitope mapping (blocking mAbs)

  • Goal: Identify functionally critical ECLs and substrate-access channels; create blocking antibodies that inhibit substrate translocation.

  • Approach: Shotgun alanine scanning or loop-swaps combined with loss-of-binding for specific mAbs; correlate with transport assays. Use peptide competition with synthetic ECL peptides to validate epitope specificity. Support for ABCC-family MSD0/L0 and ECL roles appears in structural/biochemical work cited above. Use NCI Antibody Characterization Program principles for validation pipelines: process overview, validated antibodies hub, CPTAC portal. proteomics.cancer.govdctd.cancer.govantibodies.cancer.gov

3) Immunoprecipitation (IP/Co-IP) and interactome proximity

  • Goal: Map ABCC1–regulatory protein contacts (e.g., scaffolds that engage L0), detect coupling to cytoskeletal or signaling elements.

  • Approach: Detergent-screened IP using ABCC1 mAbs vs reciprocal IPs of candidate interactors; verify by MS and orthogonal blotting. General immunocytochemistry and IP protocols are accessible at NIH/NIEHS and NCBI Bookshelf: NIEHS IHC protocols, IHC/ICC methods (Bookshelf). niehs.nih.govCNIB

4) Immunofluorescence (IF) and tissue IHC for localization

5) Fab-assisted structural biology

  • Goal: Increase particle size and orientation control for single-particle cryo-EM of ABCC1 and stabilize flexible states.

  • Approach: Raise Fabs against conformational epitopes; select Fabs that lock ATP-bound or substrate-bound states. Tutorials/reviews: Fab-enabled cryo-EM; engineering/augmentation strategies: overview of small-membrane-protein EM. PMC+1

Functional readouts that pair with antibody mapping

  1. Transport inhibition/competition. Use blocking ECL mAbs in vesicular transport or inside-out membrane assays to quantify inhibition for LTC4 and drug substrates; track ATP-dependence. Substrate chemistry reference: PubChem—LTC4. PubChem

  2. Conformation reporting. Compare antibody binding under ATP-vanadate trapping vs nucleotide-free vs substrate-bound to infer state occupancy (see MRP1 cycle analysis: kinetic/cryo-EM). PMC

  3. Orthogonal pharmacology controls. Include an ABCC1 inhibitor such as MK-571 as a small-molecule positive control while testing antibody effects: PubChem—MK-571; mechanistic notes on MK-571 as an MRP1 inhibitor: Bookshelf—selective efflux inhibition, with functional reinforcement in oncology cell models (MK-571 & siRNA enhance chemo response). PubChemCNIBPMC

  4. Clinical pharmacology context for transporters. Certain labels document ABCC1-related interactions—e.g., topotecan exposure increases with cyclosporine A (ABCB1/ABCC1 inhibitor), useful as a real-world control when interpreting ABCC1 modulation: FDA label—topotecan. FDA Access Data

  5. Genetic variation integration. Map epitope coverage against variant-rich regions; use ClinVar records for ABCC1 to annotate polymorphisms that may affect epitopes or function (example ClinVar variant record). For mouse studies and cross-species validation, see Abcc1 mouse gene page (NCBI Gene—mouse Abcc1). CNIB+1

Practical antibody selection and validation (ABCC1-specific)

Example experimental workflows

A) ECL epitope discovery + functional blocking

  1. Immunize with proteoliposomes carrying ABCC1; screen hybridomas on intact cells for extracellular binding.

  2. Map epitopes by shotgun alanine scanning or loop-peptide arrays; confirm loss-of-binding to targeted ECL residues.

  3. Transport assays: test antibody effects on LTC4 or drug efflux; use MK-571 as a positive inhibition control (PubChem—MK-571; Bookshelf inhibitor context).

  4. Kinetic state bias: compare binding in ATP/vanadate vs no nucleotide conditions; reference conformational cycle data (cryo-EM/kinetic). PubChemCNIBPMC

B) Fab-assisted single-particle cryo-EM

  1. Select high-affinity Fab(s) that bind only in specific nucleotide or substrate conditions.

  2. Prepare ABCC1–Fab complexes; collect EM data to distinguish inward-open, pre-hydrolysis, and post-hydrolysis ensembles.

  3. Integrate densities with known transporter frameworks for interpretation (transporters by cryo-EM; Fabs enable small-protein EM). PMC+1

C) Tissue IHC and outcome associations

  1. Validate a clinical IHC protocol using ACL/NCI SOPs and orthogonal WB/IF controls (NCI antibodies/SOPs; ACL info).

  2. Profile ABCC1 expression in patient cohorts; correlate with drug response or survival (e.g., Hodgkin lymphoma ABCC1 expression study: open-access).

  3. As needed, reference tumor-wide trends (e.g., pan-cancer ABCC1 analysis): 2024 NIH/PMC study. dctd.cancer.govFrederick National LaboratoryPMC+1

Reporting and reproducibility checklist (antibody-focused)

Conclusion

Antibody tools make ABCC1 structural and functional mapping tractable. ECL-directed blocking mAbs and conformation-reporting antibodies decode state occupancy during the ATP cycle; Fab fragments enable high-resolution cryo-EM; and IHC/IF with validated antibodies define cellular and clinical expression. Integrating orthogonal pharmacology (e.g., MK-571) and genetic controls (KO/KD) ensures specificity and reproducibility. For reagents and SOPs, anchor your pipeline in NCI Antibody Characterization resources and reference NIH/NCBI frameworks for genes, structures, substrates, and variants. PMC+1dctd.cancer.govproteomics.cancer.govCNIB

ABCC1 antibody, MRP1 antibody, ABCC1 extracellular loop antibody, ABCC1 conformational antibody, ABCC1 Fab cryo-EM, ABCC1 structure, ABCC1 L0 linker, ABCC1 MSD0, ABCC1 transporter inhibition, LTC4 transport, glutathione conjugate efflux, ABCC1 IHC, ABCC1 immunofluorescence, ABCC1 immunoprecipitation, MRP1 drug resistance, ABCC1 knockout control, MK-571 positive control, clinically validated antibodies, CPTAC NCI antibodies.

Structural and Functional Insights into Surfactant Protein A: Advances in Antibody-Based Research

1) SP-A at a glance (collectin biology, genes, and localization)

Surfactant Protein A (SP-A) is a collagen-containing C-type lectin (collectin) secreted into the alveolar hypophase by type II pneumocytes, where it contributes to surfactant homeostasis and host defense. Core background on pulmonary surfactant and alveolar cell biology: StatPearls—Surfactant, StatPearls—Alveolar Cells, StatPearls—Anatomy, Thorax, Lungs, and a surfactant overview in Han et al. (NIH/PMC). The human locus encodes SFTPA1 and SFTPA2; gene pages and recent updates: NCBI Gene—SFTPA1. Recent reviews summarize genetic/epigenetic variation and functional divergence of SP-A1 vs SP-A2: Floros et al. 2021 (PubMed), Silveyra et al. 2013 (PubMed). CNIB+2CNIB+2PMCPubMed

AffiAB® CART Antibody

2) Oligomeric architecture and domains

SP-A is built from trimeric subunits (each monomer has an N-terminal cysteine-rich segment, a collagen-like region, an α-helical “neck,” and a C-terminal carbohydrate-recognition domain, CRD). Six trimers assemble into a characteristic octadecamer, often described as a “flower bouquet” architecture. Educational and primary-source depictions include: Hawai‘i (edu) review PDF—Figure on SP-A octadecamer, Ohio State (edu) thesis—SP-A octadecamer schematic, Penn State (edu) hosted review PDF. High-resolution structures are available for the neck+CRD trimer: Head et al., 2003 (PubMed) and ligand complexes: Shang et al., 2011 (PubMed) / NIH/PMC entry. General collectin architecture overview: Watson et al., 2018 (NIH/PMC). Université d’Hawaïresearch.cbc.osu.eduCiteSeerXPubMed+1PMC+1

Implications for antibodies: The multimeric bouquet increases avidity for repetitive glycans; antibodies targeting CRD vs collagen/neck epitopes will report distinct conformational states and multimer content in biochemical/EM assays.

3) Pattern recognition and macrophage signaling

SP-A binds carbohydrate motifs on pathogens and altered self via its CRD and modulates alveolar macrophage programs. Documented receptors and signaling axes include:

  • SP-R210 (MYO18A): A macrophage receptor implicated in phagocytic uptake and cytokine tuning (Penn State—pure.psu.edu; confirmatory immunoprecipitation in NIH/PMC).

  • Calreticulin/CD91 complex and SIRPα pathways drive dual pro- and anti-inflammatory outputs depending on binding orientation (PubMed: 12244199, PubMed: 14531999, NIH/PMC review).

  • TLR2/TLR4 modulation: SP-A increases TLR2 expression but dampens TLR2/TLR4 signaling in human macrophages (NIH/PMC).

These mechanisms underpin opsonophagocytosis, chemotaxis, and resolution of inflammation in the distal lung. Penn StatePMC+2PMC+2PubMed+1

Image générée

4) Pathogen interaction case studies

Influenza A virus (IAV). SP-A binds IAV and attenuates infectivity; early studies showed sialic-acid–dependent interactions and HA inhibition (PubMed: 7844369; NIH/PMC). In macrophages, SP-A delays IAV endosomal trafficking and infection (PubMed: 36960051; NIH/PMC). SP-A deficiency exaggerates early inflammatory responses to IAV in mice (PubMed: 11867335). PubMed+2PubMed+2PMC+1

Mycobacterium tuberculosis (Mtb). SP-A promotes attachment and enhances macrophage phagocytosis of Mtb (NIH/PMC, Downing et al.; PubMed: 7594549). Related collectin SP-D exhibits complementary, sometimes opposing, effects via ManLAM binding (PubMed: 10384130; NIH/PMC). Mechanistic reviews: NIH/PMC—SP-A suppresses reactive nitrogen species in Mtb, and Mtb lipoglycan recognition. PMC+3PMC+3PMC+3PubMed+1

Clinical genetics context. Variants in SFTPA1/SFTPA2 have been linked to interstitial lung disease phenotypes and susceptibility traits (NIH/PMC 2022 review; CF/airways genetics associations: PubMed: 16429424). PMCPubMed

5) How antibodies enable SP-A research

5.1 Monoclonal vs polyclonal SP-A antibodies (specificity and use-cases)

  • Monoclonal antibodies (mAbs) provide epitope-level specificity—useful to distinguish CRD vs collagen/neck epitopes, detect oligomer-dependent conformers, or separate SP-A1 vs SP-A2 variant-specific motifs when available.

  • Polyclonal antibodies (pAbs) maximize sensitivity across isoforms and post-translational variants, aiding capture from BAL fluid and tissue sections.

Technical primers: NCBI Bookshelf—Monoclonal Antibody Production, “Understanding How Monoclonal Antibodies Work”, and immunology toolboxes for IP/Co-IP (NCBI Immunobiology Appendix). Comparative sensitivity in diagnostic pathology: an example survey including SP-A mAbs in lung tumors (NIH/PMC). CNIB+2CNIB+2PMC

5.2 Structural biology with antibodies (crystallography and cryo-EM)

5.3 Immunoprecipitation (IP/Co-IP) and interactome mapping

SP-A–interacting proteins can be captured either with anti-SP-A antibodies or reciprocal IP using receptor-specific antibodies. Examples include assignments around MYO18A (SP-R210) and immune receptors in human cells (NIH/PMC). Protocol resources for IP/ChIP: Bookshelf—ChIP in budding yeast, X-ChIP workflow, and methodology figures (EDEM Co-IP example) Bookshelf figure. In epithelial signaling contexts, co-IP combined with ligand blots has been used to probe SP-A interactions with EGFR pathways in A549 cells (NIH/PMC). PMC+1CNIB+2CNIB+2

5.4 Immunohistochemistry and immunogold EM

Anti-SP-A antibodies localize SP-A to lamellar body membranes, tubular myelin, and type II cell microvilli by EM/IHC (NIH/PMC—lamellar body pathway; PubMed: CD9/SP-A EM). In lung injury models, immunogold EM shows altered SP-A distribution in tubular myelin after ischemia-reperfusion (NIH/PMC). PMC+2PMC+2

6) Experimental considerations for SP-A antibodies

  • Epitope & isoform awareness. SP-A1 vs SP-A2 differences can alter epitope exposure and oligomerization; consult variant-focused analyses (NIH/PMC, NIH/PMC 2021).

  • Controls for specificity. Include knockout controls where feasible—SP-A-deficient mice are well established (NIH/PMC review; early SP-A−/− phenotyping: PubMed: 9126996, PubMed: 9761768).

  • Matrix effects. BAL fluid contains surfactant lipids/proteins; detergent and calcium conditions should be optimized to preserve CRD binding and supratrimer integrity during IP/ELISA. Background on surfactant biophysics and SP-A contributions to surface activity: NIH/PMC, NIH/PMC.

  • Cross-reactivity. Sequence/structure homology with SP-D suggests careful validation against SP-D controls; structural and ligand-binding references for SP-D are useful benchmarks (PubMed 26953329; NIH/PMC, NIH/PMC). PMC+5PMC+5PMC+5PubMed+2PubMed+2

7) Application highlights: what SP-A antibodies enable

Image générée

8) Practical notes for reproducibility

9) Selected authoritative links (.gov/.edu) to cite in-text

  • Surfactant Protein A (SP-A) antibody, SP-A monoclonal antibody, SP-A polyclonal antibody, collectin CRD, alveolar macrophages, pattern-recognition receptor, calreticulin/CD91, SIRPα, SP-R210/MYO18A, TLR2/TLR4 modulation, influenza A virus, Mycobacterium tuberculosis, cryo-EM with Fab fragments, X-ray crystallography of SP-A CRD, immunoprecipitation of SP-A complexes, immunogold electron microscopy.

Conclusion

SP-A’s octadecameric collectin architecture and CRD-mediated pattern recognition underlie broad innate-immune functions in the lung. Antibodies against SP-A—selected appropriately as monoclonal vs polyclonal—are central to (i) precise localization in tissue and EM, (ii) quantitative receptor/ligand mechanistic studies via IP/Co-IP and ligand blots, and (iii) structural interrogation of SP-A subdomains (with Fab-assisted cryo-EM approaches increasingly applicable). Together, these antibody-based toolkits continue to resolve how SP-A modulates pathogen handling (IAV, Mtb) and macrophage signaling in health and disease. Université d’HawaïPubMed+2PubMed+2PMC

Batch Variability and Reproducibility Challenges in Polyclonal Antibody Use

Why batch variability is intrinsic to polyclonal antibodies

Polyclonal antibodies (pAbs) are heterogeneous populations generated by multiple B-cell clones against diverse epitopes on an immunogen. Because each production lot derives from different animals (and often different bleeds), the clone composition, affinities, and epitope coverage inevitably shift between lots—producing measurable batch effects that impact specificity, sensitivity, and background across applications. Reproducibility concerns around research antibodies are well documented, and funders now expect explicit authentication plans for “key biological resources,” including antibodies. See the NIH guidance on rigor, transparency, and resource authentication (policy overview, application guidance, resources & examples, and the classic NIH “rigor chart” PDF highlighting antibody authentication) (PDF). grants.nih.gov+3grants.nih.gov+3grants.nih.gov+3

Peer-reviewed analyses summarize the “antibody characterization crisis,” linking poor specificity controls and lot variability to irreproducible findings (PubMed review, open-access version). Practical definitions of “fit-for-purpose” validation and the need to demonstrate specificity/selectivity in context are long established (Bordeaux et al., 2010, PMC; PubMed). PubMed+1PMC+1

AffiAB®​ Anti-Human Tissue Factor IgG

Mechanistic sources of lot-to-lot variation

  • Host & immunization: genetic background, adjuvant, immunization schedule, and bleed timing reshape the epitope/affinity distribution. Foundational reviews contrast pAbs with mAbs and explain why pAbs are inherently variable across lots (PubMed). PubMed

  • Affinity maturation over time: later bleeds can shift toward higher-affinity clones, altering EC50/IC50 and background. Guidance emphasizes re-validation when switching bleeds/lots (Bordeaux review, PMC). PMC

  • Purification differences: Protein A/G vs antigen-affinity purification changes off-target content; vendor changes to coupling density or wash conditions can move the signal/noise balance (UTHealth McGovern specificity controls). McGovern Medical School

  • Stability/handling: freeze–thaw cycles and storage buffer can degrade high-affinity subpopulations first, subtly shifting apparent affinity/specificity between aliquots (BU Western Blotting Guidebook, PDF). Boston University

Despite these risks, pAbs also have unique benefits (broader epitope coverage, tolerance to epitope masking) when properly validated (Ascoli, 2018). PubMed

Application-specific failure modes you should test for

A rigor framework you can cite in methods sections

  1. Authentication plan (grant/manuscript): NIH expects concise, actionable descriptions of how you verify identity/validity of antibodies and other key resources (NIH policy page, guidance, examples, blog explainer). grants.nih.gov+2grants.nih.gov+2nexus.od.nih.gov

  2. RRIDs and registries: cite antibodies with Research Resource Identifiers to enable unambiguous tracking of lot/clone and audits (RRID rationale; Resource Identification Initiative; Antibody Registry overview). PMC+2PMC+2

  3. Reference materials & bridging controls: where applicable, include stable controls or reference standards to monitor assay drift; for protein characterization workflows, NISTmAb RM 8671 is a well-characterized IgG1κ benchmark (NIST project; certificate PDF). NISTtsapps.nist.gov

  4. Predefined acceptance criteria: adopt quantitative validation criteria from regulatory bioanalytical guidance for ligand-binding assays—precision (%CV), accuracy (%bias), parallelism, dilution linearity, selectivity (FDA Bioanalytical Method Validation; ICH M10/FDA 2024 update) (HTML, PDF). U.S. Food and Drug Administration+2U.S. Food and Drug Administration+2

Image générée

Lot-to-lot verification workflow (WB/IHC/ELISA/Flow)

Use this 10-step, fit-for-purpose workflow whenever you change polyclonal lots or bleeds. Each step links to practical resources:

  1. Define intended use and matrix (WB, IHC-FFPE, serum ELISA, whole blood flow). Align validation to the application—see Brown University’s curated antibody validation resources (link). libguides.brown.edu

  2. Establish controls: positive/negative biological controls; peptide competition where relevant; knockout/knockdown or ectopic expression controls for specificity (UTHealth, control design). McGovern Medical School

  3. Orthogonal method: verify the same target by a method with different failure modes (e.g., WB ↔ IHC; IP-MS per ENCODE validation schema) (ENCODE antibody validation form, PDF). genome.ucsc.edu

  4. Titration & dynamic range: run serial dilutions to locate the plateau/linear range and detect affinity shifts between lots; document dilution factors and exposure times (BU WB guide, PDF). Boston University

  5. Specificity checks: absence in negative controls, peptide/antigen competition (where feasible), and band/peak at expected MW/size; confirm with complementary targets if isoforms exist (Bordeaux et al., PMC). PMC

  6. Selectivity & cross-reactivity: challenge with related antigens or clinically relevant serologies; consult CDC disease-specific cross-reactivity advisories for interpretation (dengue, rubella, Lyme). CDC+2CDC+2

  7. Precision & accuracy: intra- and inter-run %CV and %bias; predefine acceptance thresholds following FDA/ICH M10 for ligand-binding assays (guidance). U.S. Food and Drug Administration

  8. Parallelism & dilution linearity: ensure sample dilution curves are parallel to calibrators/standards to flag matrix effects. See FDA validation tables for acceptance criteria (2018 guidance, HTML). U.S. Food and Drug Administration

  9. Normalization strategy (WB/IF): choose validated loading controls or total-protein normalization; report how normalization affects CVs (Vanderbilt normalization, PDF). cdn.vanderbilt.edu

  10. Register & report: include RRIDs in methods, plus vendor, catalog, lot, host, isotype, concentration, storage, and complete protocol parameters (RRID primer, PMC; RII overview, PMC; Antibody Registry, PMC). PMC+2PMC+2

Quantitative acceptance criteria you can reuse

When adopting pAbs in regulated or quasi-regulated workflows, pre-register numerical thresholds (per assay, matrix, and dilution):

  • Precision: intra-assay and inter-assay %CV (e.g., ≤15–20% depending on level)

  • Accuracy: %bias vs. nominal/spiked value

  • Selectivity: effect of potential interferents (e.g., hemolysis, lipemia; pathogen co-exposures)

  • Dilution linearity & hook effect checks

  • Stability: bench-top, freeze–thaw, long-term; report lot-specific stability claims
    Templates and example tables are provided in FDA Bioanalytical Method Validation and ICH M10 documents (FDA 2018 HTML; ICH M10 HTML; FDA templates PDF). U.S. Food and Drug Administration+2U.S. Food and Drug Administration+2

Image générée

Reducing batch risk without abandoning polyclonals

RRID, vendor, catalog, lot/bleed, host species, isotype, concentration (RRID primer). PMC

Structural & Functional Insights into Rabbit anti-Hamster IgG F(ab’)₂

Abstract (research-focused, SEO-friendly)

Rabbit anti-hamster IgG F(ab’)₂ fragments are Fc-free, bivalent secondary antibodies generated by pepsin digestion of whole IgG. They preserve antigen binding while eliminating Fc-mediated interactions that can elevate background in flow cytometry, immunofluorescence/IHC, Western blot, and ELISA. This article maps the structural basis, fragmentation chemistry, biophysical properties (avidity vs affinity), and assay design considerations that make Rbt Xhmstr IgG F(ab’)₂ (unconjugated) a high-specificity detector—especially in Fc receptor-rich samples and complement-prone contexts. For grounding, we link to primary .edu and .gov resources throughout.

AffiAB® Rbt Xhmstr Igg Fab2 Uncnj 1Mg

1) IgG architecture and where F(ab’)₂ comes from

IgG is a heterotetramer (2 heavy + 2 light chains) with N-terminal Fab domains for antigen binding and a C-terminal Fc domain that recruits effector pathways. Disulfide bonds stabilize the hinge and inter-chain assembly. Authoritative intros are available in Janeway’s Immunobiology and NCBI Bookshelf: Ig structure overview, Immunobiology textbook. NCBI+1

Pepsin cleaves below the hinge at acidic pH, removing Fc as peptides and leaving a divalent F(ab’)₂ (~110 kDa) in which two Fab arms remain linked via hinge disulfides. Good primers and protocols: Amrita Virtual Lab: pepsin fragmentation, Harvard Med protocol PDF. vlab.amrita.eduKirschner Lab

2) Why Fc removal matters: receptors and complement

Fcγ receptors (FcγR) on monocytes, macrophages, dendritic cells, B cells, NK cells, neutrophils, etc., bind the Fc region of intact IgG, often creating non-specific background in flow/IHC. Removing Fc eliminates this binding mode. See flow-core guidance on Fc-block and background control: UF Flow Cytometry Basics, UTHealth protocols, UVA FAQs. biotech.ufl.eduMcGovern Medical Schoolmed.virginia.edu

Complement C1q binds clustered Fc domains to initiate the classical pathway; IgG requires multiple Fc-C1q engagements, whereas pentameric IgM can activate with a single molecule. F(ab’)₂ lacks Fc and therefore does not recruit C1q. References: NCBI Immunobiology: complement, NCBI Bookshelf (IgM/IgG & C1q requirement), recent complement reviews. NCBI+1PMC

Protein A/G/L are bacterial Fc-binding ligands widely used for IgG purification and can complicate blots/IPs if Fc is present. F(ab’)₂ avoids these Fc-dependent interactions: see NIH/PMC overviews of Fc-binding ligands and affinity matrices: overview, IgG Fc affinity ligands review. PMC+1

3) Bivalency, avidity, and binding kinetics (F(ab’)₂ vs Fab vs IgG)

  • Fab (monovalent): single paratope; lowest avidity; smallest hydrodynamic radius.

  • F(ab’)₂ (bivalent): two paratopes remain—higher apparent avidity and off-rate suppression for multivalent antigens; no Fc effector binding.

  • Whole IgG (bivalent + Fc): highest mass and Fc-dependent biology.

Academic summaries on affinity vs avidity: Northern Arizona lecture notes (PDF) and alt deck. For complement potency differences among IgG subclasses (context for intact IgG only): NIH/PMC articles. www2.nau.edu+1PMC

4) Why specifically rabbit anti-hamster IgG?

Hamsters are routinely used to generate mAbs to mouse/human epitopes because their phylogenetic distance can improve immunogenicity; anti-hamster secondaries are therefore standard in mouse immunology workflows. See NIH/PMC and academic reports on hamster mAbs and usage: hamster anti-mouse CD79B cloning, hamster mAbs in infectious models. PMC+1

5) Generation & QC of Rbt Xhmstr IgG F(ab’)₂ (unconjugated)

Process: pepsin digestion at low pH → Fc degraded → F(ab’)₂ purified (SEC/ion exchange). Verification:

  • SDS-PAGE: non-reducing band ~110 kDa (F(ab’)₂); under reducing conditions, heavy/light chain fragments. Examples in academic theses/protocols: MIT antibody engineering thesis, UT Austin fragment workup. DSpaceDépôts de l’Université du Texas

  • Functional ELISA against purified hamster IgG to confirm species specificity; minimal cross-reactivity to mouse/rat should be stated on the CoA (run your own cross-adsorption checks as needed).

  • Kinetics (optional): SPR/BLI to quantify secondary–primary interaction stability under your buffer conditions.

6) Where F(ab’)₂ secondaries shine in practice

6.1 Flow cytometry (FACS)

Tip: For high-myeloid samples or inflamed spleen/LN, prefer F(ab’)₂ to reduce Fc-capture; verify blocking efficacy with isotype controls and secondary-only tubes. See also MIT Fc-blocking handout. Whitehead Institute

6.2 Immunofluorescence / IHC

6.3 Western blot / ELISA / IP

7) Practical specifications for product pages

  • Name pattern: Rabbit anti-Hamster IgG F(ab’)₂, unconjugated (aka Rbt Xhmstr IgG F(ab’)₂ Uncnj).

  • Host / target: Rabbit anti-Hamster IgG (H+L) unless otherwise specified.

  • Fragment: F(ab’)₂, pepsin-generated, Fc-free, bivalent.

  • Applications (validated): Flow, IF/IHC, WB, ELISA.

  • Why choose F(ab’)₂: lower Fc-receptor binding and no C1q recruitmentlower background. (See complement and FcR sections above.) NCBIFlow Cytometry

  • Recommended controls: FcR block, secondary-only control, matched isotypes, titration curves. UVA, UTHealth. med.virginia.eduMcGovern Medical School

8) Storage & handling (unconjugated)

Short-term 2–8 °C (≤2 weeks). For longer terms, aliquot and freeze at −20 °C/−80 °C, avoid freeze–thaw, optionally add glycerol for cryoprotection where appropriate. University core guidance: DSHB (Univ. of Iowa) storage. dshb.biology.uiowa.edu

9) Troubleshooting & optimization checklist

Image générée

10) Frequently asked questions (FAQ)

Q1. F(ab’)₂ vs Fab—what’s the practical difference?
Fab is monovalent (one binding site) with lower avidity and faster off-rates; F(ab’)₂ is bivalent, improving retention on multivalent antigens without Fc. See affinity vs avidity notes. www2.nau.edu

Q2. Can F(ab’)₂ activate complement?
No. Complement C1q requires Fc engagement; F(ab’)₂ lacks Fc. See Immunobiology complement and IgM/IgG-C1q requirement. NCBI+1

Q3. Do F(ab’)₂ secondaries reduce Fc-receptor binding artifacts?
Yes—no Fc means no FcγR binding, but FcR block is still recommended in Fc-rich samples. UF guide, UTHealth. biotech.ufl.eduMcGovern Medical School

Q4. Why rabbit host for anti-hamster?
Rabbit antiserum typically yields high-affinity secondaries with broad epitope recognition; hamster primaries are common in mouse immunology. Hamster mAb usage. PMC

Q5. How should I store an unconjugated F(ab’)₂?
Aliquot; 2–8 °C short term; freeze for long term; avoid freeze–thaw; consider glycerol additions per core guidance: DSHB storage. dshb.biology.uiowa.edu

Suggested H1: Structural & Functional Insights into Rabbit anti-Hamster IgG F(ab’)₂ (Unconjugated)
H2s: Structure of IgG & F(ab’)₂ · Fc receptors & complement · Bivalency & avidity · Why rabbit anti-hamster? · Assay-specific guidance (Flow/IF/WB/ELISA) · QC & storage · FAQ
Focus keywords (sprinkle naturally): rabbit anti-hamster IgG F(ab’)₂, Fc-free secondary antibody, pepsin digestion, Fc receptor blocking, complement C1q, Protein A/G, flow cytometry, immunofluorescence, IHC, Western blot, ELISA, avidity vs affinity, Rbt Xhmstr IgG F(ab’)₂ Uncnj.

Comparative Sensitivity of Anti-TagRFP Polyclonal IgG Antibody in Fluorescent Protein Detection Systems

Anti-TagRFP polyclonal IgG (pAb) increases apparent sensitivity for TagRFP-tagged targets by leveraging avidity and signal amplification via labeled secondaries or tyramide signal amplification (TSA). Across common readouts—immunofluorescence (IF), Western blot (WB), and permeabilized flow cytometry—rigorous titration, control design, and quantitative metrics such as signal-to-noise ratio (SNR) and limit of detection (LOD) deliver consistent gains over direct TagRFP fluorescence. Practical quantification can be standardized using ImageJ/Fiji (NIH) and open measurement culture encouraged by NIST, NSF BIO, and CDC lab quality resources.

AffiAB® Goat anti-TagRFP Polyclonal IgG Antibody

1) What “sensitivity” means in antibody-based fluorescent protein detection

  • SNR: SNR=μsignal−μbackgroundσbackground\mathrm{SNR} = \dfrac{\mu_{\text{signal}} – \mu_{\text{background}}}{\sigma_{\text{background}}}

  • LOD: often estimated as μblank+3σblank\mu_{\text{blank}} + 3\sigma_{\text{blank}}

Compute SNR/LOD on raw images with ImageJ (NIH); document methods following open research habits promoted by NIH Research & Training and reproducibility norms aligned with NIST. General assay development perspectives appear in FDA Science & Research (methodology framing; not clinical guidance) and literature repositories at NCBI / PMC / MeSH.

2) Why Anti-TagRFP pAb outperforms direct TagRFP fluorescence in low-signal regimes

  1. Amplification by secondaries: multiple labeled anti-rabbit IgG bind each primary → higher fluorophore density per epitope.

  2. TSA (HRP-tyramide): covalent deposition of fluor-tyramides near the epitope yields strong local signal; manage endogenous peroxidases carefully.

  3. Epitope diversity: polyclonals recognize multiple epitopes on TagRFP, improving robustness when fixation masks subsets of epitopes.

  4. Denaturation tolerance: after SDS-PAGE, intrinsic TagRFP fluorescence is disrupted; antibody-based WB remains robust.

For microscopy hardware/setup guidance, consult core facility resources at Harvard CBI, Microscopy @ U-Michigan, and institutional primers at MIT OCW, UCSF, UC Berkeley, UCSD, Yale Medicine, Stanford.

3) Comparative sensitivity by platform

A) Immunofluorescence (IF) on fixed samples

  • Direct TagRFP: one fluor per fusion protein; fixation/pH can quench.

  • Anti-TagRFP pAb + labeled secondary: typically 5–20× apparent brightness gain (instrument/condition dependent).

  • Anti-TagRFP pAb + TSA: can achieve 20–100× apparent gain with strong blocking and peroxidase quenching.

Optimize fixation/permeabilization (PFA vs MeOH; Triton vs saponin) and blocking matrices. Facility SOPs and tutorials: Harvard CBI, U-Michigan Microscopy, MIT OCW, Princeton, Columbia.

Spectral planning: TagRFP emits in orange-red; avoid bleed-through with dyes in similar bands (e.g., Alexa 568/594, mCherry). For spectral detection/unmixing, see primers from Caltech and Cornell.

B) Western blot (WB)

  • Direct TagRFP fluorescence is lost post-SDS; anti-TagRFP pAb + HRP with chemiluminescent substrates or fluorescent secondaries restores sensitivity.

  • Validate transfer (Ponceau), optimize blocking (milk vs casein), and use enhanced ECL for low femtogram-range targets.

Method writing and documentation: NCBI/PMC, measurement ethos from NIST, and general best-practice framing in FDA Science & Research.

C) Permeabilized flow cytometry

  • Direct TagRFP measures intrinsic fluorescence but dim populations cluster near autofluorescence.

  • pAb + secondary after fixation/permeabilization increases MFI and separation index; employ Fc blocking.

  • Compensation and panel design tutorials are often hosted by core facilities and institutions such as Johns Hopkins, Stanford, Yale Medicine.

Image générée

4) Quick comparison (rule-of-thumb)

Platform Labeling strategy Apparent sensitivity vs direct TagRFP Primary drivers
IF pAb + labeled secondary 5–20× Multiple secondaries per primary; better epitope access
IF pAb + TSA (HRP-tyramide) 20–100× Covalent deposition; watch background and quenching
WB pAb + HRP (ECL) 10–100× vs direct fluorescence Denatured epitopes + chemiluminescence gain
Flow (fixed/permed) pAb + secondary 3–10× MFI shift Amplification; proper compensation, Fc blocking

Use these as heuristics. Always quantify with ImageJ and report acquisition parameters—detector type, exposure, binning, NA, and filter cubes—as encouraged by training content at UCSF and UC Berkeley.

5) Lab-ready titration & control workflow

  1. Define readout & LOD goal; pre-register acquisition settings.

  2. Prepare expression gradient (high/medium/low TagRFP) and true negative control line.

  3. Fix/permeabilize in parallel conditions (PFA vs MeOH; Triton vs saponin).

  4. Primary titration: Anti-TagRFP pAb at 1:200–1:5000; secondary titration independently.

  5. TSA branch (optional): HRP-conjugated secondary, quench endogenous peroxidases; time-course deposit.

  6. Controls: no-primary, isotype, peptide block (if immunogen peptide available).

  7. Imaging: Nyquist-appropriate pixel size; identical exposure across groups.

  8. Quantify SNR/LOD in ImageJ; archive raw data with readme following openness culture at NIH, NSF BIO.

Guidance on core-level workflows and user training is widely available at Harvard CBI, Microscopy @ U-Michigan, MIT OCW, Yale Medicine, Stanford, UCSD.

6) Spectral separation and multiplexing with TagRFP

  • Reserve an orange-red channel for TagRFP/anti-TagRFP signals.

  • In multiplex IF, assign brightest dyes to dimmest targets; verify single-stain controls; use spectral detectors when available.

  • Useful primers and facility notes can be found at Princeton, Columbia, Caltech, Cornell.

7) Troubleshooting matrix

  • Low SNR in IF: increase block (5% serum + 0.1% detergent), extend primary incubation (overnight 4 °C), reduce wash salt if epitope is labile; consider TSA.

  • High background in negatives: reduce primary 2–4×; use cross-adsorbed secondaries; confirm fixative didn’t expose sticky components; lengthen washes.

  • Flow compensation issues: build compensation with antibody-capture beads or single-stained controls; review compensation tutorials from university cores (see JHU, Yale Medicine).

  • Weak WB bands: verify transfer (Ponceau), switch blocking reagent (milk ↔ casein), try enhanced ECL. Method writing discipline is echoed by NIST and FDA Science & Research.

8) Data analysis: repeatable SNR/LOD with open tools

Use ROI-based quantification in ImageJ with batch macros; report mean, SD, background ROIs, and acquisition metadata. For literature context and terminology consistency pull definitions from MeSH and examples in PMC. Measurement thinking and uncertainty budgets fit naturally with NIST guides; training and funding context via NIH and NSF BIO.

Is Anti-TagRFP pAb suitable for live-cell imaging?
Antibody labeling requires permeabilization; use direct TagRFP for live imaging. See microscopy primers at MIT OCW and facility advice at Harvard CBI.

What filter set is ideal for TagRFP?
Choose an orange-red emission band; confirm with your facility’s filter inventory (docs at U-Michigan Microscopy, Yale Medicine).

How do I claim a numeric LOD?
Collect matched negatives, compute μ\mu and σ\sigma of blank ROIs in ImageJ; define LOD ≈ μblank+3σblank\mu_\text{blank}+3\sigma_\text{blank}. Report acquisition settings per openness norms from NIH and NIST.

Does TSA always win?
It often maximizes sensitivity but can raise background; quench endogenous peroxidases and extend blocking. Training content: Stanford, UCSF.

The Role of Rapid Antigen and Antibody Tests in Veterinary Infectious Disease Surveillance

Introduction

Veterinary infectious disease surveillance is the cornerstone of protecting animal populations, ensuring sustainable agriculture, and safeguarding One Health interfaces. Within this framework, rapid antigen (Ag) and antibody (Ab) assays—primarily based on immunochromatographic lateral-flow technology—are indispensable. They provide real-time information on pathogen presence or host exposure, bridging the gap between laboratory-based reference methods and field-based decision needs.

These assays are not substitutes for molecular diagnostics such as real-time PCR or next-generation sequencing, but rather complementary tools that enable tiered diagnostic algorithms. Their role is emphasized in surveillance systems coordinated by USDA APHIS, CDC One Health, and wildlife agencies like the USGS National Wildlife Health Center.

AffiVET® Swine Transmissible Gastroenteritis (TGE) virus, Porcine Epidemic Diarrhoea (PED) Virus & Rotavirus Antigen Rapid Test Kit

Technical Principles of Rapid Immunoassays

Antigen Detection

  • Principle: Captures structural proteins (e.g., nucleoproteins, envelope proteins) released by the pathogen in swabs, tissues, or secretions.

  • Technology: Lateral-flow strips with immobilized monoclonal antibodies, colloidal gold/latex conjugates, and nitrocellulose flow membranes.

  • Advantages: Detects active shedding, useful for acute infection surveillance.

  • Reference: Cornell AHDC—Veterinary Diagnostic Testing.

Antibody Detection

  • Principle: Detects host humoral immune response (IgM/IgG), indicating past or current exposure.

  • Applications: Essential for serosurveillance, vaccination monitoring, and regional mapping of exposure.

  • Limitation: Requires time for seroconversion; not suitable for early detection.

  • Reference: UC Davis—Veterinary Diagnostic Laboratory.

Performance Characteristics in Surveillance

  • Limit of Detection (LoD): Defines analytical sensitivity; typically validated against dilution series of cultured virus/bacteria. NIST Handbook.

  • Diagnostic Sensitivity/Specificity: Derived from field comparisons against molecular reference assays.

  • Predictive Values: Strongly dependent on prevalence. At low prevalence, even high-specificity assays require confirmatory PCR.

  • Reproducibility: Multi-operator and inter-lab reproducibility are critical for surveillance deployment.

For validation frameworks: Iowa State University VDL, Washington State WADDL.

Field Deployment Use-Cases

  1. Poultry respiratory syndromes – rapid Ag tests for avian influenza at farm level.

  2. Swine oral fluid surveillance – Ab assays for PRRSV mapping.

  3. Wildlife interface – rabies and brucellosis monitoring in feral or migratory species (USGS NWHC).

  4. Border and fair inspections – Ag assays enable triage pending laboratory confirmation (USDA APHIS).

  5. Seroprevalence surveys – Ab tests allow estimation of exposure across herds, flocks, or wildlife populations.

Image générée

Pre-Analytical and Matrix Considerations

  • Swabs: Oropharyngeal, nasal, and cloacal swabs require compatible buffers.

  • Milk: Casein and fat layers can inhibit flow; centrifugation recommended.

  • Feces: High particulate load requires clarification.

  • Blood/Serum: Hemolysis and lipemia can cause false negatives or poor migration.

For reference SOPs: MSU VDL, Texas A&M TVMDL.

Quality Assurance in Surveillance Networks

  • Positive/Negative Controls: Run with each batch.

  • Proficiency Testing: Inter-laboratory ring trials, coordinated by academic/state labs.

  • Lot Verification: Evaluate new kit lots under local matrices.

  • Documentation: QA logs per ISO/IEC 17025 frameworks (NIST Handbook).

Data Integration and Digital Tools

Field-deployed rapid tests now integrate with mobile apps and digital readers. These systems:

  • Capture geo-referenced data.

  • Automatically transfer results to LIMS and national databases.

  • Reduce human error in weak-positive line interpretation.

Example: Wildlife reporting integration via CDC One Health.

Training and Capacity Building

Operators require:

  • Training in sample collection and handling.

  • Interpretation of weak positives.

  • Biosafety protocols (see CDC BMBL).

  • Data reporting standards.

Academic institutions such as UMN College of Veterinary Medicine, NC State CVM, and UW–Madison School of Veterinary Medicine provide resources for veterinary laboratory workforce training.

Global and Regional Surveillance Initiatives

  • USDA APHIS National Surveillance Plans (link).

  • CDC One Health Zoonotic Surveillance (link).

  • FAO Reference Centers and Collaborating Institutes.

  • Academic research consortia such as CIDRAP—UMN.

Image générée

Limitations

  • Antigenic variation can reduce assay sensitivity.

  • Storage challenges in tropical field conditions.

  • Visual read subjectivity introduces bias—digital readers mitigate this.

  • Serology cross-reactivity requires careful antigen design.

  • veterinary rapid antigen test

  • antibody rapid test in veterinary medicine

  • animal disease surveillance tools

  • immunochromatographic assay veterinary

  • serosurveillance in livestock and poultry

  • field-deployable diagnostics for animals

  • veterinary biosurveillance assays

  • lateral flow assay animal health

  • surveillance workflows for animal pathogens

Conclusion

Rapid antigen and antibody assays are indispensable surveillance accelerators in veterinary infectious disease monitoring. Their ability to generate actionable results in real time makes them ideal for outbreak triage, wildlife interface management, seroprevalence surveys, and border inspections. With proper validation, QA/QC, and integration into digital reporting frameworks, these tools enhance the resilience of veterinary biosurveillance networks.

Precision in Low-Concentration DNA Quantification: Why the Qubit™ dsDNA HS Assay Outperforms UV Spectrophotometry

Introduction: Why Accurate DNA Quantification Matters

Accurate DNA quantification is the cornerstone of modern molecular biology. Applications such as next-generation sequencing (NGS), polymerase chain reaction (PCR), digital PCR (dPCR), and cloning workflows depend on precise input concentrations. Overestimation of DNA concentration can cause library failures and wasted sequencing runs, while underestimation may lead to insufficient amplification or inefficient cloning.

Traditionally, UV spectrophotometry at 260 nm (the NanoDrop™ being the most recognized example) has been the most common tool for quantification. However, when DNA is present at low concentrations (<20 ng/µL), UV absorbance measurements lose reliability due to baseline noise, pathlength correction errors, and contamination sensitivity (University of Rochester).

In contrast, fluorometric methods such as the Qubit™ dsDNA High-Sensitivity (HS) Assay use intercalating dyes that selectively bind to double-stranded DNA (dsDNA). This approach yields superior signal-to-noise ratios and greater specificity, even in samples as dilute as 10 pg/µL (UC Davis DNA Core).

AffiGEN® 1X dsDNA HS Assay Kit for Qubit

1. The Physics of UV Spectrophotometry

UV spectrophotometry is based on the Beer–Lambert law, where absorbance at 260 nm (A260) is proportional to the concentration of nucleic acids. Standard conversion factors are widely reported:

1 A260 = 50 µg/mL dsDNA

  • 1 A260 = 40 µg/mL RNA

  • 1 A260 = 33–37 µg/mL ssDNA

(See Rutgers lecture notes, University of Michigan manual, and NIST SP 1200-20).

However, when dealing with low nanogram inputs, small deviations in baseline absorbance become disproportionately large. For example, 5 ng/µL dsDNA ≈ A260 of 0.1 (1 cm path). Many microvolume devices operate near the detection limit at this level, where noise exceeds signal.

Furthermore, UV absorbance cannot distinguish between DNA, RNA, nucleotides, proteins, or phenol residues. A contaminated DNA prep may give a false high reading, leading researchers to miscalculate their input DNA (UGA ratio guide).

2. Fluorometric DNA Quantification: Principles of the Qubit dsDNA HS Assay

The Qubit dsDNA HS Assay employs a dsDNA-specific fluorescent dye that only fluoresces when bound to double-stranded DNA. RNA, single-stranded DNA, free nucleotides, and protein contaminants do not significantly contribute to the signal (San Francisco State University assay guide).

  • Dynamic range: 10 pg/µL – 100 ng/µL

  • Assayable mass range: 0.2 ng – 100 ng total DNA

  • Specificity: dsDNA only, minimizing false positives

  • Contaminant tolerance: Salt, EDTA, ethanol, and phenol tolerated at moderate levels (Smith College protocol).

This makes it highly suitable for low-input NGS workflows (NCBI comparative study).

3. Head-to-Head: Qubit vs UV Spectrophotometry

Feature UV Spectrophotometry Qubit dsDNA HS Assay
Specificity Detects all nucleic acids + contaminants Selective for dsDNA
Dynamic range ~2–3000 ng/µL 10 pg/µL – 100 ng/µL
Accuracy at <20 ng/µL Poor Excellent
Contaminant sensitivity High Low
Typical sample volume 1–2 µL 1–20 µL

References: UC Riverside, UTHSC Core, Iowa State DNA Facility.

AffiGEN® 1X dsDNA HS Assay Kit for Qubit

4. Case Study: 5 ng/µL DNA Sample

  • UV NanoDrop result: A260 ≈ 0.1 (borderline detectable). Even ±0.01 AU error leads to ±10% miscalculation.

  • Qubit HS result: Falls squarely in assay range (10 pg/µL – 100 ng/µL), yielding reproducible concentration.

This demonstrates why core facilities recommend Qubit for low-DNA submissions (East Carolina University Genomics Core).

5. Common Problems with UV-Based Quantification

  1. RNA contamination – artificially inflates DNA readings.

  2. Phenol carryover – strong UV absorbance at ~270 nm (NIH PMC study).

  3. Chaotropic salts – suppress A260/A230 ratios (NIST DNA characterization).

  4. Pathlength errors – dynamic pathlength correction fails at low absorbance.

These issues reinforce why UV purity ratios (A260/A280, A260/A230) are diagnostic, not quantitative (UC Davis FAQ).

6. Best Practices for Qubit Assays

  • Use proper standards: Always run duplicates for calibration.

  • Keep samples at room temperature: Cold samples can yield lower readings.

  • Avoid overloading: DNA above 100 ng/µL should be diluted into range.

  • Record both fluorometric and UV data: Use UV for purity, Qubit for quantification (Cornell Sanger sequencing handbook).

Image générée

7. Implications for Next-Generation Sequencing

NGS library prep protocols often require exact DNA input amounts. Overestimation by UV methods can lead to failed sequencing runs, wasting thousands of euros in reagents. Many sequencing centers mandate Qubit or PicoGreen quantification before submission (MSU RTSF, Penn State RNA-seq guidelines).

8. Historical Perspective

  • 1930s–1950s: Early DNA quantification relied on UV spectrophotometry (Rutgers notes).

  • 1990s: Intercalating dyes like PicoGreen emerged, offering higher sensitivity (NIH article).

  • 2000s: Qubit fluorometers became a standard in core labs worldwide (UC Davis).

Conclusion

For low-concentration DNA samples, the Qubit dsDNA HS assay dramatically outperforms UV spectrophotometry in both accuracy and specificity. While UV absorbance remains useful for purity checks, researchers preparing DNA for NGS, cloning, or PCR should rely on fluorometric methods to avoid costly downstream errors.

  • Primary keyword cluster: Qubit dsDNA HS assay, DNA quantification, low concentration DNA measurement, UV spectrophotometry vs Qubit

  • Secondary keywords: NanoDrop DNA limitations, A260 A280 ratio, dsDNA fluorometry, NGS DNA quantification, fluorescent DNA assay

  • Internal linking opportunities: Product pages (dsDNA HS assay kits, Qubit fluorometer instruments), related ELISA/DNA kits, NGS prep reagents

  • Structured content: H1, H2, tables, bullet lists for readability and indexing