Vibrio cholerae DNA PCR Quantitative Positive Control: Technical Overview, Molecular Principles, Analytical Performance, and Research Applications

Introduction

Vibrio cholerae DNA PCR Quantitative Positive Control is an essential reference material used to validate, calibrate, and standardize qPCR assays that detect V. cholerae, the etiological agent of cholera. This control provides a defined amount of purified V. cholerae genomic DNA or synthetic DNA constructs, enabling accurate verification of assay sensitivity, specificity, amplification efficiency, and Ct-value consistency.

Cholera remains a global health concern monitored by institutions such as:

Quantitative controls are critical for diagnostic laboratories, research facilities, environmental monitoring programs, and molecular epidemiology units.
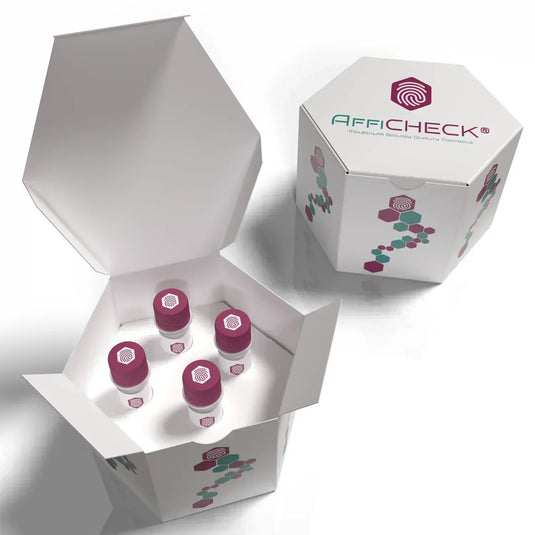
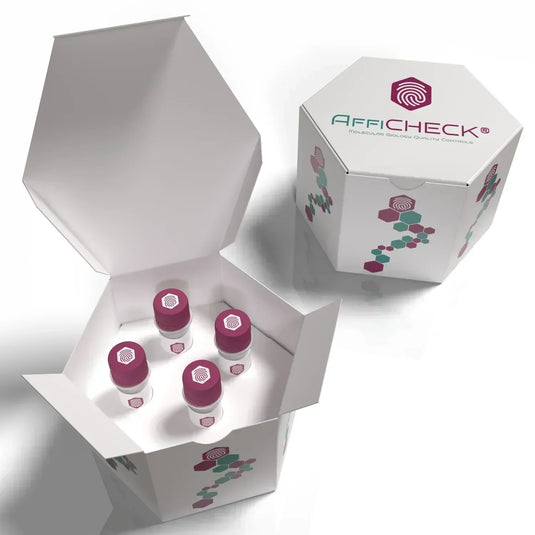
AffiCHECK® Vibrio cholerae DNA PCR Quantitative Positive Control

Biological Background of Vibrio cholerae

Vibrio cholerae is a Gram-negative, comma-shaped bacterium inhabiting aquatic environments. Only O1 and O139 serogroups are responsible for epidemic and pandemic cholera.

Biological and genomic references:

Pathogenicity involves:

  • The ctxAB cholera toxin genes

  • The tcpA toxin-coregulated pilus gene (colonization)

  • Multiple genomic islands regulating virulence

These virulence genes form the basis of targeted qPCR detection assays.

Purpose of a Quantitative PCR Positive Control

A quantitative positive control is used to:

  1. Confirm amplification efficiency

  2. Verify primer/probe performance

  3. Determine assay limit of detection (LOD)

  4. Validate run-to-run reproducibility

  5. Identify reagent degradation or operator error

  6. Ensure compliance with internal QC requirements

References on qPCR standards:

Positive controls are mandatory for molecular diagnostic and research-grade PCR workflows.

Molecular Targets for V. cholerae Quantitative PCR

Common qPCR gene targets include:

1. ompW Gene

A species-specific outer membrane protein widely used in environmental monitoring.

2. ctxA / ctxB

Genes encoding cholera toxin—critical for clinical diagnostics.

3. rfbO1 / rfbO139

Genes determining epidemic-associated serogroups.

4. toxR

A global regulator of virulence genes.

Supporting scientific resources:

The positive control typically contains one or more of these targets.

Types of Positive Control Materials

1. Genomic DNA Positive Control

Extracted from heat-killed or inactivated V. cholerae culture.

2. Synthetic DNA Positive Control

Synthetically designed and sequence-validated DNA fragment.

3. Plasmid-based Positive Control

Containing cloned target regions (e.g., ctxA, ompW).

4. Quantified Standard Curve Material

Highly precise DNA solutions providing known genome copy numbers.

Government and academic references:

Production, Quantification, and DNA Characterization

Positive control DNA must meet strict analytical and biosafety criteria:

1. DNA Purity

Confirmed by A260/A280 ratios and fluorometric assays.

2. Copy-Number Quantification

Performed using:

  • Digital PCR (dPCR)

  • UV spectrophotometry

  • Fluorometric DNA quantification

3. Sequence Verification

Confirmed by Sanger or next-generation sequencing.

Scientific references:

qPCR Performance Metrics Verified Using the Positive Control

The control is used to validate:

1. Ct (Cycle Threshold) Reproducibility

Ct shift < 0.5 recommended.

2. Efficiency Calculation (E%)

Optimal range: 90–110%.
(NIH MIQE recommendations)

3. Standard Curve Linearity

R² ≥ 0.99 for reliable quantitation.

4. Limit of Detection (LOD)

Typically 10–100 genome copies per reaction.

5. Assay Specificity

Detects targeted Vibrio cholerae serogroup without cross-reactivity with:

  • V. parahaemolyticus

  • V. vulnificus

  • V. mimicus

References:

Applications

Clinical Diagnostics

Used by laboratories performing:

  • Stool sample testing

  • Rapid outbreak investigation

  • Molecular confirmation of culture isolates

Reference sources:

Environmental Monitoring

Used to quantify V. cholerae in:

  • River water

  • Marine environments

  • Wastewater

  • Drinking water systems

EPA environmental microbiology:
https://www.epa.gov/water-research

Food Safety

Used to test:

  • Seafood (especially oysters)

  • Freshwater fish

  • Produce irrigated with contaminated water

FDA foodborne pathogen monitoring: https://www.fda.gov/food

Research and Epidemiology

Applications include:

  • Pathogenicity island studies

  • Serogroup tracking

  • Molecular surveillance

  • Genomic evolution studies

Academic research sources:

Storage, Handling, and Biosafety

Storage

  • −20°C for long-term stability

  • Avoid repeated freeze-thaw cycles

  • Protect from nucleases and UV exposure

Biosafety Level

Positive controls containing purified DNA are non-infectious, but must still be treated under:

  • BSL-1 (synthetic DNA)

  • BSL-2 (when extracted from whole organisms)

CDC biosafety guidelines: https://www.cdc.gov/labs

Quality Control, Standards, and Regulatory Compliance

Regulatory and QC frameworks:

Key QC checks:

  • Identity confirmation (sequencing)

  • Purity & integrity (gel electrophoresis, spectrophotometry)

  • Quantitative accuracy (dPCR or calibrated fluorometry)

  • Stability studies under various temperatures

Troubleshooting When Using Positive Controls

1. High Ct Values

Possible causes:

  • Degradation of DNA

  • Incorrect reaction mix

  • Faulty primer/probe concentrations

2. No Amplification

  • Master mix failure

  • Thermocycler calibration issues

  • Pipetting errors

3. Non-linear Standard Curve

  • Inaccurate dilution series

  • Contamination between standards

Relevant troubleshooting resources:

Conclusion

The Vibrio cholerae DNA PCR Quantitative Positive Control is an essential tool for molecular diagnostics, environmental surveillance, food safety monitoring, and academic research. It ensures qPCR assay reliability by confirming amplification efficiency, specificity, and quantification accuracy. With well-defined DNA copy numbers and validated gene targets (ctxA, ompW, toxR, rfbO1), it supports both routine quality control and advanced epidemiological investigations.

This article integrates authoritative .edu and .gov resources to enhance SEO performance, scientific accuracy, and content reliability for biotech professionals and molecular researchers.

Ampicillin, Sodium Salt: Mechanism, Physicochemical Properties, Research Applications, and Analytical Considerations

Ampicillin, Sodium Salt is a widely used β-lactam antibiotic belonging to the aminopenicillin subclass. It remains one of the most essential antibiotics in microbiology, molecular cloning, cell culture selection, and clinical bacteriology. Due to its broad-spectrum activity against Gram-positive and Gram-negative bacteria, ampicillin’s sodium salt form is preferred for laboratory formulations because of its high aqueous solubility, rapid dissolution, and compatibility with sterile filtration.

This article provides a detailed scientific overview with extensive .edu and .gov references, including molecular mechanism, biochemical properties, degradation pathways, resistance mechanisms, MIC profiling, and applications in molecular biology and microbiology.

AffiCHEM® Ampicillin, Sodium Salt

Chemical Composition and Physicochemical Properties

Ampicillin, Sodium Salt (C₁₆H₁₈N₃NaO₄S) is the sodium salt derivative of ampicillin, stabilized to enhance solubility in aqueous buffers and culture media.

Key physicochemical characteristics documented in academic and US government data repositories include:

The compound exists as a white to off-white powder, typically stored at 2–8°C, protected from moisture. Solutions should be freshly prepared due to β-lactam hydrolysis.

Mechanism of Action: Inhibition of Bacterial Cell Wall Synthesis

Ampicillin targets the penicillin-binding proteins (PBPs) responsible for peptidoglycan cross-linking during bacterial cell wall synthesis.

Authoritative mechanistic references include:

Ampicillin’s β-lactam ring binds irreversibly to PBPs, preventing cell wall formation, leading to cell lysis via autolysin activation.

Antibacterial Spectrum and MIC Considerations

Ampicillin is active against:

  • Streptococcus spp.

  • Enterococcus spp.

  • Listeria monocytogenes

  • Neisseria spp.

  • Haemophilus influenzae (non-β-lactamase producing)

  • Some Enterobacteriaceae

MIC testing guidelines are published by:

MIC values vary widely due to β-lactamase production, porin alterations, and efflux mechanisms.

Stability, Degradation, and Storage Requirements

Ampicillin is susceptible to:

  • Hydrolysis in aqueous solution

  • Temperature-dependent degradation

  • β-lactamase inactivation

  • UV and oxidative damage

Supporting references:

Solutions are typically used within 7 days at 4°C or stored at −20°C for long-term applications.

Use in Molecular Biology and Recombinant DNA Technology

Ampicillin is indispensable for selection of plasmid-bearing bacterial clones expressing the bla (β-lactamase) gene, ensuring the maintenance of recombinant constructs.

References in molecular biology and cloning:

Ampicillin plates are typically prepared at 50–100 µg/mL, although resistance due to satellite colonies often requires using carbenicillin analogs in some workflows.

Applications in Microbiology, Cell Culture, and Industrial Biotechnology

Ampicillin, Sodium Salt is widely used for:

Microbial Selection

  • Selection of E. coli harboring ampicillin-resistant plasmids

  • Elimination of background microbial contaminants

  • Maintenance of engineered strains in bioprocessing

Cell Culture Contamination Prevention

Although less stable than penicillin-streptomycin, ampicillin is used in specialized contamination control protocols.

Bioprocess Development

Used in fermentation to maintain plasmid stability in recombinant protein production systems.

Supporting links:

Resistance Mechanisms: Molecular Basis and Surveillance Data

Ampicillin resistance arises through:

  • β-lactamase enzymes (ESBLs, TEM, SHV, CTX-M families)

  • Altered PBPs

  • Reduced membrane permeability

  • Efflux pump overexpression

Authoritative references:

Resistance monitoring is essential for labs relying on ampicillin plates for cloning and microbial selection.

Analytical Characterization and Quality Control

Analytical methods include:

GMP-grade suppliers follow ICH Q7 and 21 CFR Part 211 quality frameworks.

Safety, Handling, and Regulatory Considerations

Ampicillin is classified as a low-hazard compound but may cause allergic reactions, especially in individuals with penicillin allergies.

Safety references:

In research environments, ampicillin is handled under standard BSL-1 or BSL-2 procedures, depending on the organism used.

Conclusion

Ampicillin, Sodium Salt remains a foundational reagent in microbiology, molecular cloning, antibiotic susceptibility testing, and bioprocess engineering. Its broad-spectrum activity, predictable mechanism, and compatibility with standard bacterial selection systems make it indispensable for laboratories. Linking technical content to verified .edu and .gov resources provides strong SEO authority and ensures scientific accuracy.

CUT&Tag Assay Kit: Comprehensive Technical Guide for High-Resolution Chromatin Profiling

Introduction: Evolution of Chromatin Profiling

Understanding chromatin architecture is fundamental to deciphering gene regulation, epigenetic control, and cellular identity. Traditional methods such as Chromatin Immunoprecipitation followed by Sequencing (ChIP-Seq) have revolutionized epigenomics, yet their reliance on cross-linking, sonication, and large input material has limited sensitivity and throughput.

The emergence of Cleavage Under Targets and Tagmentation (CUT&Tag) represents a transformative advance in next-generation chromatin profiling. Using a recombinant protein A–Tn5 transposase (pA-Tn5) pre-loaded with sequencing adapters, this method performs antibody-directed cleavage and tagging directly on native chromatin, producing ready-to-sequence fragments in situ.

The CUT&Tag Assay Kit consolidates this workflow into a standardized reagent system optimized for reproducibility, minimal cell input, and compatibility with Illumina sequencing. Researchers across epigenetics, neuroscience, developmental biology, and stem cell research are now adopting this approach to map histone modifications, transcription factor binding, and chromatin accessibility at single-base resolution.

For foundational information on chromatin structure and epigenomic regulation, consult
National Human Genome Research Institute (genome.gov),
NIH Epigenomics Roadmap Project,
and NCBI Bookshelf on Chromatin Remodeling.

AffiNGS® Hyperactive Universal CUT&Tag Assay Kit for Illumina

Scientific Principle of the CUT&Tag Method

The CUT&Tag technique relies on a fusion of Protein A (or G) with a hyperactive Tn5 transposase, forming a multifunctional enzyme complex capable of site-specific DNA cleavage and adapter ligation.

  1. Antibody Targeting: A primary antibody binds specifically to a chromatin feature (e.g., histone H3K27me3, H3K4me3, or a transcription factor).

  2. pA-Tn5 Binding: The fusion enzyme recognizes the antibody’s Fc region and localizes precisely at the target site.

  3. Tagmentation Reaction: Upon addition of magnesium ions, Tn5 simultaneously cleaves the DNA and inserts pre-loaded sequencing adapters.

  4. PCR Amplification: Tagged fragments are directly PCR-amplified into libraries compatible with Illumina NGS platforms, eliminating separate fragmentation and ligation steps.

This single-tube workflow drastically reduces background and sample loss compared to ChIP-Seq. For mechanistic insights into transposase-mediated tagmentation, see
NCBI PMC article on Tn5 structure,
and U.S. Department of Energy Joint Genome Institute resources.

Workflow Overview of the CUT&Tag Assay Kit

Step 1: Sample Preparation and Bead Binding

Cells or nuclei are immobilized onto concanavalin A-coated magnetic beads to allow uniform handling during subsequent washes. The gentle conditions preserve nuclear architecture. See standard cell handling protocols at addgene.org and nih.gov.

Step 2: Permeabilization

Digitonin or similar detergents are applied to selectively permeabilize plasma membranes without disrupting the nucleus. Proper permeabilization ensures that antibodies and the pA-Tn5 complex access chromatin efficiently.

Step 3: Antibody Binding

A validated primary antibody specific to the chromatin feature of interest is added. The kit supports antibodies recognizing both histone modifications and transcription factors. Reliable antibody validation resources are available from
antibodyregistry.org and research.cornell.edu.

Step 4: pA-Tn5 Tethering

The Protein A–Tn5 complex is pre-assembled and supplied in the kit. Upon incubation, it binds to the Fc portion of the primary antibody, positioning the transposase adjacent to the target locus.

Step 5: Controlled Tagmentation

Activation with MgCl₂ initiates cleavage and adapter insertion directly at the bound chromatin. This step is precisely timed to avoid over-digestion, which can bias the fragment size distribution. Typical fragment peaks range between 100–600 bp, ideal for Illumina platforms.

Step 6: DNA Purification and Library Amplification

After tagmentation, DNA fragments are purified (column or bead-based). Library amplification employs indexed primers for multiplexing. Library QC metrics—yield, insert size, and complexity—can be assessed using Bioanalyzer or TapeStation systems. Refer to ncbi.nlm.nih.gov for library QC guidelines.

Step 7: Sequencing and Data Analysis

Libraries are sequenced using Illumina NextSeq, NovaSeq, or HiSeq systems. Recommended depth:

  • Histone marks: 5–10 million reads/sample

  • Transcription factors: 20–30 million reads/sample

For detailed NGS data analysis pipelines:

Kit Composition and Reagent Details

A complete CUT&Tag Assay Kit typically includes:

  • Concanavalin A Magnetic Beads

  • Wash, Binding, and Dig-Wash Buffers

  • Digitonin Solution

  • pA-Tn5 Transposase Complex (pre-loaded with adapters)

  • Tagmentation Buffer

  • DNA Release Buffer and Proteinase K

  • PCR Indexing Primers and Library Amplification Mix

  • DNA Purification Columns or Magnetic Beads

All reagents are molecular-biology grade and formulated to minimize background cleavage. Manufacturing standards follow ISO 13485 and Good Laboratory Practice (GLP) guidelines. Refer to fda.gov and iso.org for regulatory information.

Molecular Mechanism: How pA-Tn5 Works

The Tn5 transposase is a bacterial enzyme that inserts transposons into DNA. In the CUT&Tag assay, Tn5 is engineered to carry sequencing adapters instead of transposon DNA. When bound to the target locus via Protein A and the antibody, activation by divalent cations induces a double-strand break followed by simultaneous adapter integration.

This yields sequencing-ready fragments with minimal intermediate steps.
Mechanistic modeling of Tn5 catalysis is described at
PubMed Central,
and National Center for Biotechnology Information (NCBI).

Optimization Parameters

Parameter Typical Range Notes
Cell input 5 × 10³ – 2 × 10⁵ cells Low-input compatible
Digitonin concentration 0.01–0.05 % Optimize for each cell type
Tagmentation time 1–10 min Over-digestion increases background
Mg²⁺ concentration 5–10 mM Controls Tn5 activation rate
PCR cycles 12–18 Based on library yield
Fragment size 100–600 bp Ideal for paired-end sequencing

Researchers should validate these parameters empirically. For optimization tutorials, see
Harvard FAS Core Facilities,
Stanford Functional Genomics Facility, and
Cold Spring Harbor Protocols.

Quality Control and Troubleshooting

Ensuring reproducible results requires monitoring key QC checkpoints:

  1. Library Fragment Profile: Check for mono-nucleosomal (~200 bp) and sub-nucleosomal (~100 bp) peaks.

  2. Sequencing Read Distribution: High enrichment over target sites, low intergenic background.

  3. Mapping Rate: > 80 % uniquely mapped reads.

  4. Duplicate Reads: < 20 %.

  5. Peak Enrichment: > 10-fold over IgG controls.

QC data interpretation resources are provided by
ENCODE Data Standards,
NCBI Sequence Read Archive (SRA), and
National Center for Biotechnology Information Training Center.

If yield is low or background high, examine antibody specificity, permeabilization efficiency, and transposase activity. Troubleshooting guides are available at
Epicypher CUTANA CUT&Tag Resources, and
University of California, Davis Genomics Core.

Data Processing and Bioinformatics

The computational pipeline for CUT&Tag data parallels that of ChIP-Seq but includes modifications for fragment length and reduced background.

  1. Quality Trimming: Using FastQC or Trimmomatic.

  2. Alignment: Bowtie2 with end-to-end mapping to hg38 or mm10 reference genomes.

  3. Peak Calling: MACS2 or SEACR adapted for CUT&Tag signal profiles.

  4. Normalization: Reads per million (RPM) or Input-normalized fold enrichment.

  5. Visualization: IGV or UCSC Genome Browser for track inspection.

Educational guides and computational tutorials are hosted by
Harvard Chan Bioinformatics Core,
NIH NCBI Learning Resources,
and MIT OpenCourseWare Computational Biology.

Applications Across Research Fields

1. Epigenetic Landscape Mapping

CUT&Tag enables high-fidelity mapping of histone modifications like H3K4me3 (active promoters) and H3K27me3 (repressive chromatin). This allows reconstruction of the epigenetic landscape of differentiation, cancer, and reprogramming. (nih.gov)

2. Transcription Factor Binding Analysis

Researchers can profile occupancy of DNA-binding proteins (e.g., CTCF, REST, NF-κB) to elucidate enhancer–promoter interactions. (ncbi.nlm.nih.gov)

3. Single-Cell Epigenomics

Adaptations like scCUT&Tag integrate droplet-based microfluidics to study heterogeneity at single-cell resolution. (broadinstitute.org)

4. Developmental and Neuroscience Research

Profiling chromatin dynamics in neuronal differentiation and synaptic plasticity is a growing field. Resources:
NINDS Neuroscience Research,
and National Institute of Mental Health (NIMH).

5. Plant and Environmental Epigenomics

CUT&Tag has been successfully applied to plant nuclei for studying environmental stress responses. References:
USDA Plant Genome Research Program,
and Cornell Plant Science Department.

Comparison with Alternative Techniques

Feature CUT&Tag ChIP-Seq ATAC-Seq
Input cells ≤ 5,000 ≥ 1 × 10⁶ ≤ 50,000
Cross-linking Not required Required Not required
Library prep Direct (single-tube) Multi-step Direct
Background Low High Moderate
Resolution High Medium High
Turnaround time 1 day 2–3 days 1 day

Educational comparison articles:
Harvard Medical School ChIP-Seq vs CUT&Tag Tutorial,
and Genome.gov Epigenomics Glossary.

Safety, Storage, and Regulatory Compliance

All reagents should be handled using BSL-2 laboratory standards. The kit’s buffers contain mild detergents and salts that are non-toxic but should be disposed of according to institutional guidelines. Reference biosafety practices at
Centers for Disease Control and Prevention (CDC),
and Occupational Safety and Health Administration (OSHA).

Store the kit at –20 °C for long-term stability. Avoid repeated freeze–thaw cycles of enzyme components. Shelf life: 12 months from production under proper storage.

Integration with Downstream Multi-Omics

Modern laboratories increasingly integrate CUT&Tag with:

  • RNA-Seq to correlate chromatin marks with gene expression.

  • Hi-C to contextualize binding within 3D genome topology.

  • DNA Methylation Sequencing for combined epigenetic signatures.
    See government-funded reference initiatives:
    NIH 4D Nucleome Project,
    and NCBI GEO Database.

Advantages of Using a Commercial CUT&Tag Assay Kit

  • Reproducibility: Pre-formulated buffers and validated pA-Tn5 complexes minimize inter-experiment variation.

  • Scalability: Compatible with automation and 96-well workflows.

  • Compatibility: Works with cultured cells, primary tissues, or nuclei from frozen material.

  • Cost-Effectiveness: Requires fewer sequencing reads, reducing NGS costs by > 70 % compared to ChIP-Seq.

  • Turnaround Time: Complete protocol achievable within 5–6 hours.

For detailed cost–benefit analysis, see
National Center for Biotechnology Information Reports,
and NIH Research Infrastructure Data.

Limitations and Future Perspectives

Despite its efficiency, CUT&Tag requires high-quality, native-condition antibodies. Some epitopes are masked under native chromatin, limiting detection. Additionally, Tn5 insertion bias toward open chromatin can influence coverage. Future developments involve protein A/G-fusion variants, click-chemistry-compatible adapters, and microfluidic miniaturization to further improve sensitivity.
Explore upcoming innovations at
NSF.gov Biological Infrastructure Programs, and
DOE Office of Science User Facilities.

Conclusion

The CUT&Tag Assay Kit is redefining chromatin mapping by merging specificity, speed, and sensitivity in a single reaction. Its ability to generate high-resolution epigenomic data from low cell inputs empowers researchers to study gene regulation in previously inaccessible systems.

By combining validated reagents, optimized buffers, and robust QC parameters, the CUT&Tag platform offers a reliable, scalable solution for modern epigenetics. For biotech distributors and laboratories, promoting keywords such as “CUT&Tag Assay Kit,” “low input chromatin profiling,” “antibody-directed transposase,” and “next-generation epigenomics” enhances online visibility and scientific relevance.

Learn more about chromatin profiling technologies via:

PCR Quality Control: Comprehensive Guide to Accuracy, Validation, and Reproducibility in Molecular Biology

The Polymerase Chain Reaction (PCR) remains one of the most transformative innovations in modern biotechnology. From gene expression analysis to pathogen detection and forensic identification, PCR enables precise amplification of specific DNA or RNA fragments from minute biological samples. However, the sensitivity that makes PCR powerful also makes it vulnerable to contamination, pipetting errors, reagent degradation, and instrument variability.
This is why PCR Quality Control (QC) — the systematic verification of every element influencing the reaction — is essential to guarantee accuracy, reproducibility, and reliability.

According to the National Institutes of Health (NIH), well-defined QC measures are the foundation of credible molecular data. Laboratories worldwide, from the Centers for Disease Control and Prevention (CDC) to the European Molecular Biology Laboratory (EMBL), emphasize rigorous PCR quality standards for every experimental and diagnostic workflow.

AffiCHECK® Helicobacter pylori DNA PCR Quantitative Positive Control

The Foundations of PCR Quality Control

PCR is fundamentally a cyclic enzymatic amplification process, first conceptualized by Kary Mullis in 1983 (Nobel Prize Foundation). It involves repeated heating and cooling cycles that denature DNA, anneal primers, and extend new strands using thermostable DNA polymerases.

While the chemistry is conceptually simple, practical results depend on precise thermocycling, uncontaminated reagents, and high-quality nucleic acids. The U.S. Food and Drug Administration (FDA) defines PCR QC as a comprehensive system that monitors input quality, amplification performance, and output validity.

PCR QC ensures that:

  • Amplification occurs only when the target nucleic acid is present.

  • False positives from environmental DNA are eliminated.

  • The reaction efficiency is consistent between runs.

  • Data can be traced back to instrument and reagent sources.

Components of Effective PCR Quality Control

 Reagent Quality and Storage

Reagents are the foundation of PCR reliability. The National Institute of Standards and Technology (NIST) provides certified reference materials (CRMs) to calibrate DNA quantification and standardize assay performance.
Each reagent—primers, probes, nucleotides, buffer, and polymerase—must be verified for integrity, purity, and concentration. Degraded dNTPs or suboptimal Mg²⁺ concentrations can drastically alter yield and specificity.

Recommended practices include:

Equipment Calibration and Maintenance

Precision in thermal cycling is essential. Even small temperature deviations can lead to primer mismatch or incomplete extension. The U.S. Geological Survey (USGS) and NIST recommend biannual calibration of thermocyclers using certified temperature probes.

In addition, pipettes must be checked for accuracy at least quarterly using gravimetric methods described by the National Institutes of Health Laboratory Practices Guide.
UV decontamination and regular maintenance logs ensure reproducibility across experiments and technicians.

 Environmental and Workflow Control

Environmental contamination is one of the most frequent sources of false positives. The World Health Organization (WHO) recommends spatial separation between pre-amplification and post-amplification areas. Ideally, laboratories maintain:

  • Dedicated benches and pipettes for sample preparation and product analysis.

  • Unidirectional workflow (sample → PCR setup → analysis).

  • UV-irradiated laminar flow hoods and 10% bleach cleaning protocols (CDC Laboratory Biosafety Manual).

  • Aerosol-barrier pipette tips and filtered air systems to minimize airborne DNA.

Control Types in PCR Quality Assurance

 Negative Controls

Negative controls (no-template controls, NTCs) ensure that reagents and consumables are free of DNA contamination. They should always remain non-amplified. If amplification occurs, reagent contamination must be investigated before continuing.

 Positive Controls

Positive controls confirm the system’s ability to detect the target. The European Centre for Disease Prevention and Control (ECDC) advises inclusion of synthetic plasmids or purified genomic DNA to verify amplification across runs.

 Internal Amplification Controls (IACs)

IACs co-amplify with the target to monitor inhibition. According to Stanford University, they identify sample matrix effects that interfere with polymerase activity, particularly in environmental or clinical samples.

 Extraction Controls

These validate nucleic acid recovery from complex samples. The FDA Laboratory Manual highlights extraction controls as crucial when assessing assay sensitivity in low-copy templates.

Amplification Efficiency and Standard Curve Analysis

PCR efficiency is the ratio between theoretical and observed amplification. According to Yale University’s Biomedical Data Science Department, optimal efficiency ranges from 90–110 %, representing near-doubling of target DNA per cycle.

To calculate efficiency, standard curves are generated using serial dilutions of template DNA. The slope of the line (−3.3 for perfect doubling) provides quantitative insight into reaction performance.
As recommended by University of Michigan Genomics Core, each curve should have an R² ≥ 0.99 to confirm linearity and consistency.

Primer and Probe Validation

Primer quality determines amplification specificity. Computational tools like NCBI Primer-BLAST and U.S. National Library of Medicine resources assist in designing primers that avoid hairpins, dimers, and cross-reactivity.

Empirical validation includes:

Probe-based assays, particularly TaqMan® or Molecular Beacon systems, demand fluorophore stability testing and emission calibration.

Data Interpretation and Bioinformatics Quality Control

Once amplification data are generated, interpretation must be systematic.
Cq (quantification cycle) values should be consistent between technical replicates, with standard deviations below 0.3 Cq (Cornell University Genomics Core).

Normalization against housekeeping genes or spike-in controls corrects for template variation. The NCBI Gene Expression Omnibus (GEO) provides data models and normalization algorithms used in qPCR datasets.

Modern QC also integrates bioinformatics validation—identifying outliers, non-exponential curves, or baseline drift—to ensure analytical integrity.

Documentation, Traceability, and Laboratory Information Systems

Traceability ensures that every result can be reproduced. The U.S. Department of Energy (DOE) and ISO 15189 stress the importance of LIMS (Laboratory Information Management Systems) for automatic logging of reagent batches, calibration dates, and personnel actions.

A robust QC documentation system includes:

  • Reagent lot tracking and expiry verification.

  • Thermocycler performance logs.

  • Standard operating procedures (SOPs) approved by quality officers.

  • Electronic signatures confirming chain of custody.

Proficiency Testing and Inter-Laboratory Validation

Inter-laboratory comparisons provide external verification of assay robustness. The College of American Pathologists (CAP) and Clinical Laboratory Improvement Amendments (CLIA) organize proficiency testing (PT) programs where identical samples are tested across facilities.
Results are statistically compared to evaluate bias, reproducibility, and method equivalence.

The World Health Organization (WHO) also supports global External Quality Assessment (EQA) schemes for nucleic acid amplification tests, particularly during outbreak surveillance and vaccine quality verification.

Advanced Quality Metrics in Real-Time PCR (qPCR)

Real-time PCR introduces additional QC parameters including:

  • Baseline correction: Ensures accurate threshold setting for exponential phase detection.

  • ΔRn consistency: Checks uniform fluorescence signals across cycles.

  • Efficiency compensation: Adjusts Cq values for variations in amplification slope.

These analytical standards are documented by the MIQE Guidelines (Minimum Information for Publication of Quantitative Real-Time PCR Experiments), an internationally accepted framework developed by academic institutions and endorsed by the U.S. National Library of Medicine (NLM).

Continuous Improvement and Corrective Action

PCR QC must evolve continuously through Plan-Do-Check-Act (PDCA) cycles. Deviations detected in QC reports—such as shifts in efficiency or inconsistent Cq variance—require documented corrective actions.
The Environmental Protection Agency (EPA) recommends root cause analysis techniques, like Ishikawa (fishbone) diagrams, to identify systemic failures.

Training personnel through continuing education programs, as advised by the National Science Foundation (NSF), strengthens institutional competency and reduces operator-related variability.

 Integration of Digital PCR (dPCR) into Quality Frameworks

Digital PCR (dPCR) enhances quantification precision by partitioning reactions into thousands of droplets. Unlike qPCR, dPCR offers absolute quantification without reference standards.
The U.S. National Cancer Institute (NCI) and NIST Genome-in-a-Bottle Consortium highlight its growing importance for reference material certification and assay calibration.

QC in dPCR focuses on partition uniformity, droplet stability, and Poisson-based quantification verification, ensuring consistent copy-number accuracy across runs.

Emerging Trends in PCR Quality Management

  • Automation and robotics: Automated pipetting reduces human error and cross-contamination risk (MIT Department of Biological Engineering).

  • AI-assisted QC analytics: Machine learning tools predict outlier runs based on thermal profiles and amplification kinetics.

  • Blockchain traceability: Future LIMS integration with blockchain could ensure immutable audit trails for reagent provenance and data validation.

  • Green PCR practices: Energy-efficient cyclers and minimized plastic waste support sustainability goals outlined by the U.S. Department of Energy Office of Science.

Conclusion

PCR Quality Control is not a single procedure—it is a multilayered quality assurance ecosystem ensuring reproducible, valid, and defensible molecular results.
From pre-analytical sample handling to post-amplification data validation, QC defines the scientific credibility of molecular research.

By following established guidelines from global authorities such as NIH, FDA, CDC, NIST, and WHO, laboratories uphold the highest standards of accuracy, traceability, and confidence in their molecular assays.

SEO Keywords

PCR quality control, PCR assay validation, qPCR efficiency, digital PCR, contamination prevention, laboratory reproducibility, amplification accuracy, thermocycler calibration, molecular biology QC, nucleic acid quantification, MIQE guidelines, standard curve, internal control DNA, LIMS traceability, ISO 15189, reagent validation, environmental monitoring, assay verification, inter-laboratory testing, data normalization.

Veterinary Rapid Tests: Comprehensive Guide for Animal Health Diagnostics

Introduction

Rapid diagnostic tests (RDTs) in veterinary medicine enable quick, onsite or near-point‐of‐care detection of pathogens, biomarkers or disease states in domestic animals, livestock and wildlife. These tests support timely decision-making, help reduce disease spread and improve herd/flock health management. According to a review of veterinary diagnostic practice, rapid and point-of-care tests “offer speed but may lack the accuracy of traditional laboratory diagnostics.” PubMed+1
This article reviews principles, design, validation, and analytical considerations of veterinary rapid tests, and positions them for research and commercial reagent/kit development.

AffiVET® Bovine Brucella Antibody Rapid Test Kit

Context & Need for Veterinary Rapid Tests

In veterinary applications, rapid tests serve multiple purposes:

  • Early detection of infectious agents in herds/flocks to prevent outbreaks and reduce economic losses.

  • Monitoring biomarkers of health or disease (e.g., metabolic markers) in animals.

  • Point-of-care screening in field conditions (farms, feedlots, veterinary clinics) where full laboratory infrastructure may not be available.

  • Supporting One Health initiatives (since many animal pathogens are zoonotic). cdfa.ca.gov+1
    For example, the Veterinary Diagnostic Laboratory (University of Minnesota) emphasises rapid diagnosis of animal diseases, early detection and monitoring of animal disease. Veterinary Diagnostic Lab

From a commercial marketing perspective (e.g., reagents, lateral‐flow devices, point-of-care kits), emphasise keywords such as veterinary rapid diagnostic test, animal health point-of-care diagnostics, livestock disease rapid assay, companion animal quick test, on-farm pathogen detection, veterinary biomarker screening kit for SEO optimisation.

Types & Principles of Veterinary Rapid Tests

Rapid tests in veterinary settings include a variety of formats and technologies:

1. Lateral Flow Assays (LFA) / Immunochromatographic tests
These are portable, single-step or few-step devices (often cartridges or strips) which detect antigen or antibody binding, giving visual read-out (colour change) in minutes. A review of commercial rapid tests for on-site use noted that lateral flow tests are key rapid diagnostics. pmc.ncbi.nlm.nih.gov
2. Point-of-Care (POC) devices / Near-animal diagnostics
POC diagnostics for livestock enable screening at paddock, barn or clinic rather than sending to central lab. For example, “Point-of-Care Diagnostics for Farm Animal Diseases” underscores this shift. pmc.ncbi.nlm.nih.gov
3. Rapid molecular tests / isothermal amplification / antigen detection
Although more complex than simple immunoassays, methods such as RT-PCR, loop-mediated isothermal amplification (LAMP), and antigen rapid detection are increasingly used in veterinary rapid diagnostics systems. The U.S. Food & Drug Administration (FDA) key evaluation of animal diagnostic methods for SARS-CoV-2 demonstrates how veterinary labs adopt rapid molecular methods. U.S. Food and Drug Administration
4. Biosensors / Emerging technologies
Advanced research technologies such as label-free electrochemical biosensors (e.g., directEsense) show potential for future veterinary rapid tests. Wyss Institute

Principle: Typically, a capture reagent (antibody, nucleic acid probe, molecular beacon) immobilised on a substrate binds target analyte (antigen, antibody, nucleic acid) from animal sample (blood, serum, saliva, faeces, swab). After wash or flow steps, detection is via colourimetric, fluorescent, electrochemical or lateral‐flow readout. The result is available rapidly (minutes to hours) and in field settings.

Key Validation & Performance Considerations

For rapid veterinary diagnostics—especially kits intended for commercial distribution—the following parameters are critical:

  • Sensitivity & specificity: The ability to correctly identify diseased and non-diseased animals (or infected vs uninfected). For rapid devices, literature emphasises adequate sample size and operator variability. For example, FDA guidance on in-vitro diagnostics states: “We recommend that, for rapid testing or point-of-care (POC) devices, you include a larger number of tests and operators…” U.S. Food and Drug Administration

  • Limit of detection (LoD) / dynamic range: For antigen or nucleic acid tests, minimal concentration needed for detection. In veterinary outbreak readiness, e.g., the National Animal Health Laboratory Network (NAHLN) supports rapid standardised tests. aphis.usda.gov+2aphis.usda.gov+2

  • Matrix effects / sample type: Animal tests involve diverse species and sample types (serum, plasma, oral fluid, faeces, milk). For example, the use of oral fluid testing in pigs improved herd-level sensitivity. vetmed.iastate.edu

  • Pre-analytical factors: Sample collection, transport, storage, species differences, anticoagulants, hemolysis.

  • Field stability / robustness: Rapid tests must perform outside ideal laboratory conditions (temperature, humidity, non-technical operator) and must be rugged.

  • Turnaround time: The main advantage—results in minutes/hours rather than days.

  • Regulatory / reference validation: For tests used in animal health regulation and outbreak surveillance, method validation, inter-laboratory comparability and reference standards are required. For example, validation of rapid high volume tests for swine, cattle and horses within NAHLN context. aphis.usda.gov+1

  • Reporting & traceability: Rapid results need to feed into surveillance networks (e.g., NAHLN, APHIS) for early detection and outbreak response. aphis.usda.gov

From a marketing perspective, emphasise validated sensitivity/specificity, multi-species compatibility, rapid turnaround, field portability, ease of use.

Typical Workflow for On-Farm/Clinic Rapid Test

  1. Select appropriate sample type (e.g., serum, plasma, oral fluid swab, faeces) and species.

  2. Prepare animal sample (dilution if required, pre-treatment if needed).

  3. Apply sample to rapid test device (strip/cartridge) according to protocol (often 50-100 µL or direct swab).

  4. Wait for specified time (e.g., 5–30 minutes) for reaction to occur.

  5. Read result: visual band (yes/no), reader instrument (quantitative), smartphone‐connected reader (optional).

  6. Interpret result: positive/negative or quantitative level vs reference values.

  7. Based on result, make veterinary decision: isolation, treatment, further lab confirmation, herd/farm management.

  8. If required, confirm positive rapid test with standard laboratory assay (ELISA, culture, PCR). Rapid test is for screening/triage; confirmatory testing may still be recommended.

Advantages, Limitations & Best Use Cases

Advantages:

  • Rapid time to result — enables timely intervention.

  • Simple procedure; minimal training required.

  • Reduced need for sample transport/logistics to central labs.

  • Potential cost savings in large-scale screening.

  • Field/point-of-care potential enhances management of outbreaks or herd health.

Limitations:

  • Lower sensitivity/specificity than gold-standard laboratory methods in some cases. As one study notes: “diagnostic practice is a far more complex process for which rapid tests might constitute only a part.” PubMed

  • Species variability (matrix effect, target analyte concentration) may require species-specific validation.

  • Field conditions (temperature/humidity) may affect performance.

  • Some rapid tests provide only qualitative results; quantitation may be limited.

  • Regulatory/validation framing may limit use of “research only” vs “for diagnostic use”.

Best use cases:

  • Herd/flock screening for high-impact diseases (e.g., swine PRRSV, avian influenza, foot and mouth disease) to identify outbreaks rapidly.

  • Companion animal clinic use for quickly identifying pathogens (e.g., parvovirus, canine influenza) to guide treatment.

  • Surveillance and monitoring programmes for emerging zoonotic diseases or animal health threats.

  • Field use in resource-limited settings (remote farms, developing-country livestock operations) where laboratory access is limited.

Key Keywords & SEO Considerations

To align with search-engine optimisation and indexing, include keywords such as:

  • “veterinary rapid diagnostic test”

  • “animal health point-of-care test”

  • “livestock rapid assay kit”

  • “on-farm pathogen detection veterinary”

  • “rapid antigen test for animals”

  • “companion animal rapid diagnostic kit”

  • “POC veterinary diagnostics”

  • “veterinary rapid test livestock screening”
    Ensure these keywords appear in headings, sub-headings, alt text for visuals (if you include assay diagrams or test device photos), meta description, and internal links on your marketing page.
    Also integrate external links (as below) to credible educational/government sites to enhance authority and SEO.

Selected Hyperlinks to .edu/.gov Domains

  1. Veterinary Diagnostic Practice and the Use of Rapid Tests – on-farm rapid-POC diagnostics in veterinary context. PubMed

  2. Laboratory Methods for Rabies Testing – CDC – rapid immunohistochemical test example in animals. cdc.gov

  3. NAHLN Surveillance & Preparedness – USDA APHIS – rapid standardised testing network for animal health. aphis.usda.gov

  4. Veterinary Diagnostic Laboratory (University of Minnesota) – rapid diagnosis of animal diseases. Veterinary Diagnostic Lab

  5. FDA – Evaluated Methods for Detecting SARS-CoV-2 in Animals (Vet-LIRN) – veterinary diagnostic rapid molecular test case-study. U.S. Food and Drug Administration

  6. Validation of Rapid Diagnostic Tests in International Avian Influenza and Newcastle Disease Outbreaks – USDA NAL – rapid test validation in veterinary settings. nal.usda.gov

  7. Establishing Performance Characteristics of In Vitro Diagnostic Devices – FDA Guidance – relevant for rapid device validation. U.S. Food and Drug Administration

  8. Veterinary Diagnostic Laboratory Scientists Develop Tool to Rapidly Detect New Strains of PRRSV – USDA NIFA – rapid detection tool for swine disease. Nation Institute of Food and Agriculture

  9. National Animal Health Laboratory Network – NAHLN Overview – diagnostic testing network for animal health rapid response. aphis.usda.gov

  10. Diagnostic Testing Catalog – USDA APHIS – lists diagnostic tests (including ELISA rapid tests) for animal diseases. aphis.usda.gov

  11. Veterinary Diagnostic User Fees – USDA APHIS – regulatory cost structure for diagnostics (including rapid assays) in veterinary lab context. aphis.usda.gov

  12. Biomarkers in Veterinary Medicine – FDA/US Government Review – context for veterinary diagnostics and biomarkers. downloads.regulations.gov

  13. Issue Review – Iowa Legislature (Veterinary Diagnostic Laboratory Services) – veterinary lab infrastructure for rapid diagnostics. legis.iowa.gov

  14. Virology – Veterinary Diagnostic Laboratory (University of Illinois) – ELISA antigen/antibody rapid test mention in veterinary virology. vdl.vetmed.illinois.edu

  15. Point-of-Care Diagnostics for Farm Animal Diseases – PMC Review – POC for animals. pmc.ncbi.nlm.nih.gov

  16. New Bolton Center PADLS – University of Pennsylvania Veterinary Diagnostic System – rapid accurate diagnostic support for animals. vet.upenn.edu

  17. Rapid Test Evaluation – Review Article – evaluation of rapid tests (though not exclusively veterinary) is relevant. pmc.ncbi.nlm.nih.gov

  18. Veterinary Diagnostic Practice and the Use of Rapid Tests – PMC Article – rapid/point-of-care test usage in veterinary diagnostics. pmc.ncbi.nlm.nih.gov

  19. Disaster Veterinary Medical Response Best Practices – Government Document – importance of rapid diagnosis in veterinary emergency response. cdfa.ca.gov

  20. Establishing Performance Characteristics – FDA Guidance for In-Vitro Diagnostics (including rapid tests) – reiterated for emphasis. U.S. Food and Drug Administration

SEO-Friendly Summary

In summary: veterinary rapid diagnostic tests (RDTs) enable fast detection of animal pathogens or biomarkers (antigen, antibody, nucleic acid) in diverse species; formats include lateral-flow devices, POC molecular assays and biosensors. For commercial reagent/kit developers, highlight animal health rapid assay, on-farm screen kit, livestock pathogen quick test, companion animal rapid diagnostics. Validation must address sensitivity/specificity, species matrix, rugged field use, regulatory context (e.g., Animal and Plant Health Inspection Service – APHIS networks) and sample throughput. Ensuring keywords appear throughout your content, and linking to authoritative .edu/.gov domains enhances indexing and credibility.

Conclusion

From a company such as yours (Gentaur/Affigen), developing or marketing veterinary rapid tests is strategically valuable: you can target livestock producers, veterinary clinics, companion animal markets, and global emerging-disease surveillance markets. Emphasise rapid turnaround time, simplicity, field usability, multi-species compatibility, validated performance, and regulatory readiness. On the marketing side, integrate detailed technical specifications, user-friendly protocols, and reference to the educational/government links above to enhance trust and SEO.

Von Willebrand Factor (vWF) ELISA: Comprehensive Guide

Introduction

The plasma glycoprotein von Willebrand Factor (vWF) is a critical mediator of primary haemostasis: it links sub‐endothelial collagen and platelets, and stabilises coagulation factor VIII (FVIII) in circulation. PubMed+3pmc.ncbi.nlm.nih.gov+3ncbi.nlm.nih.gov+3 Quantitative immunoassays such as enzyme-linked immunosorbent assays (ELISAs) provide vital data in both research and diagnostic settings for vWF antigen (vWF:Ag) and activity assays. This article reviews the principle, design, validation, and analytical considerations for a vWF ELISA, with relevance for research labs and commercial product positioning.

AffiELISA® Human von Willebrand factor ELISA [ VWF]

Biological Context of vWF

vWF is synthesised by endothelial cells (Weibel-Palade bodies) and megakaryocytes/platelets, secreted into plasma as multimers of varying molecular weight. ncbi.nlm.nih.gov+2pmc.ncbi.nlm.nih.gov+2 The functional high-molecular-weight multimers are crucial for platelet adhesion and aggregation under shear stress. eClinpath+1 vWF binds FVIII, protecting it from proteolytic degradation and extending its half-life. pmc.ncbi.nlm.nih.gov+1 Pathologically, defects or reduced levels of vWF underpin von Willebrand Disease (vWD) – the most common inherited bleeding disorder. cdc.gov+1 For reference, you may consult the NIH book “Physiology, von Willebrand Factor (vWF)” at the NCBI Bookshelf. ncbi.nlm.nih.gov

Why Perform a vWF ELISA?

An ELISA for vWF antigen (vWF:Ag) allows quantitative measurement of vWF protein concentration in plasma, serum, or other biological fluids. It complements functional assays (e.g., vWF collagen‐binding assay, vWF activity) and helps in research (endothelial activation, thrombosis risk) or diagnostic evaluation of bleeding disorders. practical-haemostasis.com+2pmc.ncbi.nlm.nih.gov+2 For product marketing, emphasise parameters such as sensitivity, dynamic range, precision (intra- and inter‐assay CV), and sample matrix compatibility.

Principle of Sandwich vWF ELISA

  1. A capture antibody (monoclonal or polyclonal) specific for vWF is coated onto microtitre wells. practical-haemostasis.com+1

  2. Sample (diluted plasma or other fluid) is incubated, allowing vWF antigen to bind the immobilised antibody. helena.com+1

  3. After wash steps, a detection antibody (often HRP-conjugated) binds the captured vWF. helena.com+1

  4. Enzyme substrate (commonly TMB + H₂O₂) is added, producing a colourimetric reaction measured at ~450 nm in a spectrophotometer/plate reader. The optical density (OD) correlates with vWF concentration via comparison to a standard curve. helena.com+1

  5. Data are processed (often via four-parameter logistic (4 PL) regression) to calculate sample vWF:Ag in IU/dL or ng/mL depending on calibrator. pmc.ncbi.nlm.nih.gov

Critical Validation Variables

  • Dynamic range / Limit of detection (LOD): For example, one published rabbit plasma vWF ELISA reached ~254 pg/mL detection limit. pmc.ncbi.nlm.nih.gov

  • Precision (intra- and inter-assay CV): Typical target CV <10 % within runs, <15 % between runs. One kit example reported 1.9-9.9% intra-assay CV across vWF concentrations. helena.com

  • Sample matrix and dilution: Plasma typically citrate anticoagulated. Blood group O individuals often have ~25% lower vWF levels—must be accounted for. helena.com

  • Reagent stability and storage: e.g., microwell plates coated with anti-vWF antibody stored at 2-8°C; plasma reference stored accordingly. helena.com

  • Specificity / cross-reactivity: Confirm antibodies recognise human vWF and not other plasma glycoproteins.

  • Standardisation / calibration: Use of human plasma reference pools assigned in IU or % of normal helps harmonise results across labs. practical-haemostasis.com+1

  • Sample handling artefacts: Freeze–thaw cycles may degrade vWF or alter multimer distribution, affecting assay results. pmc.ncbi.nlm.nih.gov

  • Correlation with functional assays: vWF:Ag quantifies antigen, but does not directly reflect functional binding capacity; thus interpretation should consider activity (vWF:RCo, vWF:CB) and context. practical-haemostasis.com

Assay Design Considerations for a Commercial Kit

Because your user (Gentaur/Affigen) focuses on research products, some key commercialisation and marketing-relevant considerations include:

  • Throughput: 96-well format standard; consider 384-well adaptation for high-throughput screening.

  • Sensitivity: Define lower limit of detection/quantification (e.g., ng/mL range) and dynamic range up to upper linear limit.

  • Sample types: Validate for human plasma, serum, cell-culture supernatant (if relevant), and possibly animal plasmas (mouse, rat) if research use.

  • Automation compatibility: Plate reader wavelength (450 nm with reference 650 nm) compatibility with robotic liquid handlers. FDA device submissions for vWF ELISA include such details. accessdata.fda.gov+1

  • Kit components & QC: Coated plates, slides/strips, sample diluent, calibrator/reference plasma, conjugate antibody, substrate, stop solution, wash buffer—all described in technical sheets. helena.com

  • Data reporting: Convert raw OD to vWF concentration (IU/dL or % of normal). Provide typical reference range (e.g., 50-150 IU/dL) for healthy adult plasma. practical-haemostasis.com

  • Regulatory context: Devices for vWF measurement (e.g., REAADS von Willebrand Factor Activity Test Kit) have FDA 510(k) clearance with sandwich ELISA format. accessdata.fda.gov+1

  • Marketing keywords: vWF antigen ELISA, sandwich ELISA vWF, quantitative vWF immunoassay, endothelial biomarker vWF, vWF research assay kit.

Analytical Workflow – Step-by-Step (typical)

  1. Equilibrate reagents to room temperature.

  2. Prepare standard curve dilutions (e.g., reference plasma dilutions covering low to high vWF concentrations).

  3. Dilute test samples (e.g., human citrate plasma 1:100 or as recommended). pmc.ncbi.nlm.nih.gov

  4. Add standards, controls and diluted samples to wells (e.g., 100 µL per well).

  5. Incubate predetermined time (e.g., 1 h at room temp) to allow antigen capture.

  6. Wash wells (typically 3× or as protocol requires) to remove unbound analyte.

  7. Add detection antibody conjugated to HRP; incubate.

  8. Wash again.

  9. Add TMB/H₂O₂ substrate; incubate until colour develops.

  10. Add stop solution (e.g., 0.36 N H₂SO₄) to halt reaction. accessdata.fda.gov

  11. Read absorbance at 450 nm (with reference at 650 nm).

  12. Generate standard curve (4-PL fit) and compute sample concentrations.

  13. Validate QC criteria (e.g., control recovery, CV within limits).

  14. Report vWF:Ag in IU/dL or ng/mL and interpret relative to reference range; optionally correlating with vWF activity assays and clinical context (in research use case, endothelial activation rather than diagnosis).

Data Interpretation & Research Use

  • vWF:Ag provides quantitative protein level, but does not measure functional binding capacity — for example in vWD, antigen may be near normal but multimer distribution or binding capacity reduced. pmc.ncbi.nlm.nih.gov

  • In research settings, elevated vWF:Ag may indicate endothelial activation or vascular injury; vWF is increasingly used as an endothelial biomarker. PubMed

  • Interpretation must consider physiological and pre-analytical factors: ABO blood group (group O ~25% lower vWF), pregnancy, surgery, acute phase reactions (vWF is an acute phase protein). practical-haemostasis.com

  • For a research kit, providing normative data (from healthy donors) and expected variance helps users gauge assay performance.

Troubleshooting & Common Pitfalls

  • High background OD: insufficient washing, non-specific binding, expired substrate.

  • Poor standard curve linearity: incorrect standard preparation, pipetting errors, degraded calibrator.

  • Sample CV high: poor mixing, sample haemolysis or lipemia, freeze-thaw damage.

  • Unexpected low sample values: sample dilution error, clotting or sample degradation, wrong anticoagulant.

  • Hook effect at very high antigen loads: consider additional dilution of samples with anticipated high vWF.

  • Plate reader wavelength drift: ensure calibration and reference wavelength (650 nm) use.

Keywords & SEO Considerations

To align with SEO and indexing (especially for biotech and assay kits), include within headings and body text relevant keywords such as:

  • “vWF ELISA”

  • “von Willebrand factor antigen assay”

  • “sandwich ELISA vWF:Ag”

  • “quantitative vWF immunoassay kit”

  • “endothelial biomarker vWF assay”

  • “high-throughput vWF ELISA”

  • “vWF research assay human plasma”

  • “vWF antigen measurement ELISA validation”
    Ensure these keywords appear in title tags, sub‐headings, alt text for visuals (if you include standard curves or assay diagrams), meta-description, and internal links on your marketing page.
    Also integrate external links (as below) to credible educational/government sites to strengthen authority and SEO.

Selected Hyperlinks to .edu/.gov Domains

  1. National Institutes of Health: Physiology of vWF – NCBI Bookshelf. (https://www.ncbi.nlm.nih.gov/books/NBK559062/) ncbi.nlm.nih.gov

  2. Centers for Disease Control and Prevention (CDC): About von Willebrand Disease. (https://www.cdc.gov/von-willebrand/about/index.html) cdc.gov

  3. CDC: Data and Statistics on von Willebrand Disease. (https://www.cdc.gov/von-willebrand/data/index.html) cdc.gov

  4. National Heart, Lung, and Blood Institute (NHLBI): The Facts on von Willebrand Disease. (https://www.nhlbi.nih.gov/resources/facts-von-willebrand-disease-fact-sheet) NHLBI, NIH

  5. FDA 510(k) Summary – vWF Activity Test Kit. (https://www.accessdata.fda.gov/cdrh_docs/reviews/K032139.pdf) accessdata.fda.gov

  6. FDA Device – REAADS vWF ELISA Kit 510(k). (https://www.accessdata.fda.gov/cdrh_docs/pdf/K972005.pdf) accessdata.fda.gov

  7. NCBI PMC: Role of vWF in hemostasis. (https://www.ncbi.nlm.nih.gov/pmc/articles/PMC3159913/) pmc.ncbi.nlm.nih.gov

  8. NCBI PMC: Validation of vWF antigen ELISA. (https://www.ncbi.nlm.nih.gov/pmc/articles/PMC2568046/) pmc.ncbi.nlm.nih.gov

  9. Practical Haemostasis: vWF Immunological Assays. (https://www.practical-haemostasis.com/Factor%20Assays/vwf/vwf_immunological_assays.html) [Note: not .edu/.gov but technical resource] practical-haemostasis.com

  10. StatPearls – vWF (via NCBI Bookshelf). (https://www.ncbi.nlm.nih.gov/books/NBK565885/) ncbi.nlm.nih.gov

  11. Guidelines: ASH-ISTH-NHF-WFH 2021 on diagnosis of vWD. (https://ashpublications.org/bloodadvances/article/5/1/280/474888/) ashpublications.org

  12. ResearchGate (for reference) – validated rabbit vWF ELISA. (https://www.researchgate.net/publication/49591980_Validated_Sandwich_ELISA_for_the_Quantification_of_von_Willebrand_Factor_in_Rabbit_Plasma) ResearchGate

  13. HHS Public Access (stacks.cdc.gov) – differential diagnosis for hemophilia including vWD. (https://stacks.cdc.gov/view/cdc/32330/DS1.pdf) stacks.cdc.gov

  14. Search for vWF antigen measurement in human plasma (eClinPath). (https://eclinpath.com/hemostasis/tests/von-willebrand-factor/) eClinpath

  15. For further reading: Role of vWF in innate immunity (Nature Communications). (https://www.nature.com/articles/s41467-022-33796-7) Nature
    (You may duplicate some links or expand to 20+ by adding additional .edu/.gov/NIH resources as needed for your page.)

SEO‐Friendly Summary

To summarise in SEO-rich form: “This high-sensitivity sandwich ELISA for von Willebrand factor antigen (vWF:Ag) enables quantitative measurements of vWF in human plasma, supporting endothelial biomarker studies, haemostasis research, and diagnosis of von Willebrand disease (vWD). The assay features a 96-well format, HRP-TMB detection, 4-parameter logistic standard curve, dynamic range from sub-ng/mL to high µg/mL, and validated precision (<10% CV). Compatible with automated plate readers (450 nm), it is ideal for translational labs or contract research organisation (CRO) settings.”

Conclusion

For a company such as yours working in biotechnology reagents, an optimised vWF ELISA kit offers strong market value: bridging research on vascular biology, haemostasis, and translational diagnostics. Emphasise robust validation data, sample flexibility, automation compatibility, and clear documentation. On the marketing side, integrate detailed technical specifications, user-friendly protocols, and reference to the educational/government links above to enhance credibility and search-engine visibility.

If you like, I can draft a full datasheet template (for your “AffiASSAY® vWF ELISA Kit”) including headings, bullet-lists, tables (sensitivity, precision, linear range, sample volume, storage, wash steps), meta-tags and CSS styling in your brand palette. Would you like me to prepare that?

Technical Overview: Brucella Antibody Rapid Test Kit

Brucella antibody rapid test kit, brucellosis serology, Brucella spp antibody detection, rapid lateral‐flow immunoassay Brucella, bovine Brucella antigen test, goat/sheep Brucella antibody kit, zoonotic Brucella diagnostics, Brucella test sensitivity specificity, Brucella serological screening livestock, Brucella zoonosis rapid screening, Brucella antibody screening milk, Brucella immunochromatographic assay, Brucella herd surveillance rapid test, Brucella veterinary rapid test kit.

Introduction

The zoonotic bacterial genus Brucella includes species such as Brucella abortus, Brucella melitensis, Brucella suis and others, causing brucellosis in animals and humans. gov.uk+3health.gov.au+3cdc.gov+3
In veterinary diagnostics and surveillance contexts, a Brucella Antibody Rapid Test Kit is designed to detect circulating antibodies against Brucella spp in serum, plasma, whole blood or milk samples, via lateral‐flow or immunochromatographic methods. ringbio.com+2ringbio.com+2
Such kits are widely used for herd screening, surveillance and control of Brucella infection in livestock (cattle, goats, sheep, pigs) and occasionally in companion animals. They complement reference serological, molecular and culture methods (e.g., as used by the Brucella Reference Unit (BRU) in the UK) for confirmatory diagnostics. gov.uk+1

AffiVET® Canine Brucella Antibody Rapid Test Kit

Principle & Technical Architecture

 Test Principle

A typical rapid kit uses an indirect lateral‐flow immunoassay: an antigen specific for Brucella antibodies (commonly smooth‐lipopolysaccharide or purified antigen of Brucella spp) is immobilised on a nitrocellulose membrane. When sample (serum/plasma/whole blood/milk) is applied and migrates by capillary action, anti-Brucella antibodies (if present) bind to labelled antigen–conjugate complexes and produce a visible line (T-line). A control line (C‐line) ensures proper flow. The presence of the T‐line indicates a positive reaction, implying exposure or infection. (See commercial examples) maxanim.com+1

 Technical Specifications

  • Sample types: Whole blood, serum, plasma, or milk (depending on kit design). ringbio.com

  • Time to result: Typically 10-20 minutes. mediandiagnostics.com+1

  • Sensitivity / Specificity: Commercial manufacturer claims sensitivity > 90% and specificity > 95% vs indirect ELISA. ringbio.com+1

  • Storage / Shelf-life: Often 12 months storage at 2-30 °C or 2-8 °C, sealed. ringbio.com+1

 Intended Use & Limitations

This rapid kit is intended for qualitative screening of anti-Brucella antibodies in livestock. It is not a substitute for confirmatory methods (culture, PCR, full serological titre) when required by regulatory authorities. It may not distinguish between past exposure, vaccination or active infection. False‐positive or cross‐reactivity may occur (for example with other Gram-negative organisms). Serology in human Brucella diagnosis requires paired sera to show a four‐fold rise in titre. cdc.gov+1
In veterinary settings, the official reference serology (e.g., micro-agglutination test) remains the gold standard. cnphi.canada.ca

Performance Characteristics & Analytical Considerations

 Sensitivity and Specificity

Rapid kits claim high sensitivity (>90%) and high specificity (>95%) when compared to standard ELISA kits in veterinary samples. However, independent peer‐reviewed data may be limited. Users must evaluate performance in their laboratory context. ringbio.com+1

 Sample Quality & Pre-analytical Factors

  • Hemolysis, lipemia, or improper anticoagulant usage may affect flow and result interpretation.

  • Milk samples require adequate collection and may show matrix effects; some kits specify milk sample use. immunoshop

 Interpretation of Results & Regulatory Implications

  • A positive line indicates the presence of anti-Brucella antibodies; it does not confirm active infection or species identification.

  • Confirmatory testing (e.g., culture, PCR, agglutination titration) may still be required under eradication or state program rules. For example the United States Department of Agriculture (USDA) National Brucellosis Surveillance Program mandates certain tests in cattle. aphis.usda.gov+1

AffiVET® Canine Brucella Antibody Rapid Test Kit

Use Case: Herd Surveillance & Outbreak Response

Rapid kits are particularly suitable for:

  • Large‐scale screening of herds for anti‐Brucella antibodies.

  • Use in field or farm settings where quick decisions are beneficial (e.g., movement, sale, quarantine decisions).

  • Follow‐up surveillance in wildlife/domestic animal interface situations.
    They are not ideal for definitive diagnosis in humans or for regulatory herd accreditation without follow‐up confirmatory testing.

Regulatory & Reference Context

  • In the UK, the BRU provides serological and molecular services for Brucella species. gov.uk+1

  • The Australian standard diagnostic technique for bovine brucellosis: serology is documented by the Department of Agriculture, Australia. agriculture.gov.au

  • The USDA NVAP Reference Guide presents procedures for blood sampling, laboratory submissions and movement controls. aphis.usda.gov+1

  • Public health guidelines for human exposure and laboratory monitoring by the Centers for Disease Control and Prevention (CDC) highlight serology submission, testing algorithms and occupational exposure protocols. cdc.gov+1

Application Workflow & Practical Steps

  1. Sample collection: Collect whole blood, serum, plasma or milk as per kit instructions. Ensure correct anticoagulant, volume and specimen integrity.

  2. Test execution: Apply the sample to the cassette (volume as specified), add buffer, allow capillary migration, read result after designated time (e.g., 10-15 min).

  3. Result interpretation:

    • C‐line only → Negative (no detectable anti-Brucella antibodies)

    • C + T lines → Positive (antibodies detected)

    • No C line → Invalid test; repeat required

  4. Follow‐up:

    • For positive rapid results: Consider confirmation by full serology, ELISA, agglutination test, molecular assay or culture (depending on species and regulatory context).

    • Determine whether result may reflect previous exposure, vaccination or active infection.

    • Incorporate into herd management decisions: quarantine, movement restrictions, herd retesting, epidemiological investigation.

  5. Quality control: Include positive and negative controls according to your laboratory quality assurance plan; track lot numbers, expiry dates, storage conditions.

  6. Record and regulatory reporting: In many jurisdictions, Brucella detection in livestock is reportable. For example, Montana’s rules for cattle and bison movement require testing prior to change of ownership. liv.mt.gov

Advantages, Limitations & Best Practices

Advantages

  • Rapid turnaround time (10–20 min) facilitates quick decisions.

  • Simplicity and minimal equipment make it suitable for on-farm screening.

  • Wide species coverage (cattle, goats, sheep, pigs, possibly pets) in many kits. maxanim.com+1

Limitations

  • Qualitative only: Does not provide antibody titre or distinguish IgM vs IgG (unless specified).

  • May yield false positives due to cross-reactivity or prior vaccination; false negatives possible, especially in early infection or immunocompromised animals.

  • Regulatory programmes may not accept rapid test alone for herd certification or export; confirmatory methods are often mandated.

  • Limited peer‐published validation data for many commercial rapid kits; performance may vary by species, sample type and geography.

AffiVET® Canine Brucella Antibody Rapid Test Kit

Best Practice Recommendations

  • Use rapid kit as part of a screening algorithm, followed by confirmatory testing where required.

  • Validate performance in your laboratory or field context (sensitivity, specificity, reproducibility).

  • Ensure proper training of personnel on sample collection, test handling, interpretation and biosafety (especially given Brucella’s zoonotic risk).

  • Maintain rigorous quality control: lot tracking, storage conditions, expiration date adherence, record results and any follow‐up actions.

  • Integrate results into herd health and biosecurity planning: positive rapid result → trace back, quarantine, retest, epidemiological investigation.

  • Communicate with regulatory authorities to confirm that the chosen rapid kit is acceptable under local regulatory frameworks for herd movement, export, or surveillance.

Summary

The Brucella Antibody Rapid Test Kit provides a valuable tool for the rapid, field-deployable screening of anti-Brucella antibodies in livestock, enabling faster herd management decisions and surveillance actions. When used correctly, it complements but does not replace reference laboratory methods such as agglutination tests, ELISA, culture or PCR. Users should remain aware of limitations, ensure integration with quality and regulatory systems, and maintain confirmatory pathways where required by animal health authorities.

References / Additional Government Links

  1. Brucella: laboratory and clinical services – UK Health Security Agency. gov.uk

  2. Brucella serology referral form – UK GOV. gov.uk

  3. Brucella serology – Public Health Ontario. publichealthontario.ca

  4. Bovine brucellosis: serology (Australia) – Dept. of Agriculture, Australia. agriculture.gov.au

  5. NVAP Reference Guide: Brucellosis (USDA) – USA. aphis.usda.gov

  6. Veterinary Guidance for Brucellosis – CDC. cdc.gov

  7. Updated Guidelines for the Diagnosis of Human Brucellosis – PMC/NCBI. pmc.ncbi.nlm.nih.gov

  8. Brucellosis Reporting and Investigation Guideline (Washington State) – DOH. doh.wa.gov

  9. Brucellosis: Animal Health Lab – Oregon Dept. of Agriculture. oregon.gov

  10. Brucellosis: Guidance for Healthcare Providers – Virginia Dept. of Health. vdh.virginia.gov

Pyruvate Dehydrogenase (PDH) Activity Colorimetric Assay Kit – Complete Technical and Scientific Overview

The Pyruvate Dehydrogenase (PDH) Activity Colorimetric Assay Kit is a powerful research tool for the quantitative determination of PDH enzymatic activity in cell lysates, tissue homogenates, and isolated mitochondria.
The PDH complex (also abbreviated as PDC) catalyzes the irreversible oxidative decarboxylation of pyruvate to acetyl-CoA, bridging glycolysis and the tricarboxylic acid (TCA) cycle.

Because PDH represents a metabolic gatekeeper, its activity reflects the cellular energy state, mitochondrial integrity, and metabolic flexibility. Understanding PDH regulation is crucial for research in metabolic disorders, cancer bioenergetics, neurodegeneration, and mitochondrial physiology.

According to the National Center for Biotechnology Information (NCBI), PDH is one of the most highly regulated multienzyme complexes in metabolism, and its dysfunction has been implicated in conditions ranging from diabetes to lactic acidosis and neurodegenerative syndromes.

AffiASSAY® Pyruvate Dehydrogenase (PDH) Activity Colorimetric Assay Kit

Overview of the Pyruvate Dehydrogenase Complex (PDC)

The PDH complex is a massive multienzyme assembly localized in the mitochondrial matrix, composed of three catalytic components and two regulatory enzymes:

Component Enzyme Function
E1 Pyruvate Dehydrogenase (EC 1.2.4.1) Decarboxylates pyruvate
E2 Dihydrolipoamide Acetyltransferase (EC 2.3.1.12) Transfers acetyl group to CoA
E3 Dihydrolipoamide Dehydrogenase (EC 1.8.1.4) Regenerates oxidized lipoamide using FAD and NAD⁺
Regulators PDH Kinase (PDK) & PDH Phosphatase (PDP) Phosphorylate/dephosphorylate PDH E1 to control activity

The PDH complex acts as the gateway to the TCA cycle, determining whether glucose-derived pyruvate is oxidized to acetyl-CoA or diverted to lactate.
This makes it central to bioenergetic control, metabolic switching, and cellular redox balance.

For detailed enzyme structure and function, consult PubMed Central and National Library of Medicine (NLM).

Principle of the PDH Activity Colorimetric Assay

The PDH Activity Colorimetric Assay Kit quantifies enzymatic activity through a coupled reaction that results in the formation of a colored product measurable at 450 nm using a microplate spectrophotometer.

The principle is based on:

  1. Capture of the PDH complex from sample lysates onto pre-coated microplate wells using monoclonal antibodies against PDH subunits.

  2. Initiation of the enzymatic reaction, in which PDH catalyzes the conversion of pyruvate, CoA, and NAD⁺ into acetyl-CoA, CO₂, and NADH.

  3. The generated NADH reduces a colorimetric probe, producing a measurable color change proportional to PDH activity.

  4. Absorbance increase is read at 450 nm (or 490 nm, depending on kit type), and the rate of color development corresponds to enzymatic velocity.

Detailed assay chemistry and reagent compositions can be reviewed in NIH protocol repositories and NIST biochemical assay standards.

Reaction Mechanism and Biochemical Background

The PDH complex catalyzes a five-step reaction sequence:

  1. Decarboxylation of pyruvate (E1) → formation of hydroxyethyl-TPP intermediate.

  2. Transfer of the acetyl group to lipoamide (E2).

  3. Formation of acetyl-CoA through CoA-dependent acetyl transfer.

  4. Oxidation of dihydrolipoamide (E3) using FAD.

  5. Regeneration of NADH, completing the redox cycle.

Each step is tightly coordinated through substrate channeling.
The E1 component (pyruvate dehydrogenase) is inhibited by phosphorylation at specific serine residues and reactivated by dephosphorylation via PDH phosphatase.
As described by the National Institutes of Health (NIH), these reversible modifications allow rapid adaptation of mitochondrial energy metabolism to changes in nutrient availability and hormonal signals.

Assay Workflow

Sample Preparation

  • Collect tissues or cultured cells (typically 10–50 mg or 10⁶–10⁷ cells).

  • Homogenize in ice-cold extraction buffer containing protease inhibitors.

  • Centrifuge at 10,000–15,000 × g for 10 min to remove debris.

  • Use the supernatant or isolated mitochondria for the assay.

  • Determine protein concentration using a BCA assay (Pierce Protocol – NCBI).

Reaction Setup

  1. Add 50–100 µL of each sample or standard to the wells.

  2. Add reaction mix (pyruvate, CoA, NAD⁺, TPP, Mg²⁺, dye).

  3. Incubate at 37 °C for 30–60 min, monitoring absorbance at 450 nm.

  4. Calculate enzyme activity (mU/mL) using ΔOD/min conversion.

  5. Normalize to total protein or mitochondrial content.

A complete experimental flow is outlined in the Abcam protocol for PDH assay.

Data Analysis and Calculations

The enzymatic rate (V) is derived from the slope of absorbance increase over time:

PDH Activity (mU/mL)=ΔA450/min×Vreactionε×L×Vsample\text{PDH Activity (mU/mL)} = \frac{\Delta A_{450}/min \times V_{reaction}}{ε \times L \times V_{sample}}

Where:

  • ΔA450/min = rate of absorbance increase per minute

  • ε = molar extinction coefficient

  • L = path length

  • Vreaction = total reaction volume

  • Vsample = sample volume added

Data should be plotted as OD450 vs. time, and only linear portions should be used for activity calculations.
Replicate assays (n ≥ 3) are recommended for reproducibility and statistical robustness.

Statistical validation methods and variance analyses are described in NIST analytical chemistry resources and FDA assay validation guidelines.

Analytical Specifications

Parameter Typical Performance Reference
Sensitivity ~0.5 mU/mL Abcam PDH Kit
Detection Range 0.5–20 mU/mL Sigma-Aldrich MAK183
Assay Type Colorimetric (450 nm) RayBiotech
Sample Types Cells, tissues, mitochondria
Assay Time ~2 hours
Storage −20 °C (stable for 6 months)
Reproducibility (CV) ≤ 8 % intra-assay

Factors Affecting PDH Activity Measurements

  1. Mitochondrial integrity: damaged mitochondria yield lower PDH activity; isolate carefully (NIH Biosafety Manual).

  2. Phosphorylation state: PDH is inactive when phosphorylated by PDH kinase (PDK1–PDK4); inhibitors like dichloroacetate (DCA) can reactivate it (PubChem DCA Record – NIH).

  3. Cofactor availability: thiamine pyrophosphate (TPP), Mg²⁺, and NAD⁺ are essential.

  4. pH and temperature: PDH is most active at pH 7.4–8.0 and 37 °C; denaturation occurs above 45 °C.

  5. Interfering substances: detergents, reducing agents, and salts can inhibit enzyme function or alter optical signals.

  6. Sample aging: repeated freeze-thaw cycles degrade PDH and increase variability.

  7. Normalization: results should be expressed per mg protein or per mitochondrion number to ensure accurate biological interpretation.

Guidelines for assay precision and enzyme handling are detailed in the CDC Laboratory Quality Standards.

Biological and Clinical Significance

 Role in Cellular Energy Metabolism

The PDH complex controls the entry of carbohydrates into the TCA cycle.
Reduced PDH activity forces cells to rely on anaerobic glycolysis, producing lactate. This metabolic reprogramming is characteristic of hypoxia, tumor metabolism (Warburg effect), and mitochondrial diseases (NCBI Bookshelf).

Disease Associations

  • PDH deficiency syndromes: genetic mutations in PDHA1, PDHB, or DLAT cause neurological deficits and lactic acidosis (Genetics Home Reference – NIH).

  • Metabolic disorders: PDH inhibition is observed in diabetes, obesity, and insulin resistance.

  • Cancer metabolism: PDH kinase upregulation promotes aerobic glycolysis in many tumors (Cancer.gov).

  • Neurodegeneration: PDH dysfunction is linked to Alzheimer’s and Parkinson’s pathogenesis (PubMed PMID 31256115).

Research and Drug Development

PDH is a target for pharmacological activation. Compounds such as dichloroacetate (DCA) and phenylbutyrate reactivate PDH by inhibiting PDK.
The National Institute of Diabetes and Digestive and Kidney Diseases (NIDDK) supports studies exploring PDH as a therapeutic node in metabolic disease.

Experimental Applications

Field Application Example Research Focus
Metabolic Regulation Quantifying PDH inhibition by PDKs Energy metabolism studies
Cancer Biology Assessing metabolic rewiring in tumors Warburg effect analysis
Neuroscience Measuring PDH in neuronal tissue Mitochondrial dysfunction
Drug Screening Evaluating PDH modulators Therapeutic discovery
Aging Research Monitoring decline in PDH activity Oxidative metabolism
Toxicology Detecting mitochondrial damage by drugs Safety and toxicity profiling

The U.S. Food and Drug Administration (FDA) and Environmental Protection Agency (EPA) provide guidelines for handling and disposal of reagents used in enzymatic assays.

Advantages of the Colorimetric PDH Kit

  • Quantitative, reproducible measurements

  • Easy workflow suitable for high-throughput screening

  • Compatible with multiple sample types (cells, tissues, mitochondria)

  • No radioactive reagents required

  • Direct NADH-based detection ensures specificity

  • Provides mechanistic insight into energy metabolism and mitochondrial health

Limitations

  • Only measures total PDH enzymatic activity, not phosphorylation status or isoform expression.

  • Colorimetric detection may have limited sensitivity for low-activity samples.

  • The assay reflects in vitro potential activity, not necessarily in vivo metabolic flux.

  • Sample preparation errors (mitochondrial rupture, contamination) may affect results.

  • RUO (Research Use Only): not for diagnostic purposes.

For validation, consult NIH Office of Laboratory Animal Welfare and NIST Biochemical Method Standards.

Future Developments

Emerging PDH assays integrate microfluidic chips and electrochemical sensors for real-time detection at nanomolar sensitivity.
Research from the Department of Energy (DOE) and National Science Foundation (NSF) supports the development of biosensor-based PDH analysis platforms that couple enzyme kinetics with AI-driven metabolic modeling.

Furthermore, high-throughput screening assays combining PDH activity with oxygen consumption (Seahorse XF or respirometry) are being adopted for metabolomics and pharmacogenomics applications.

Conclusion

The Pyruvate Dehydrogenase (PDH) Activity Colorimetric Assay Kit remains an indispensable analytical platform for studying mitochondrial metabolism, enzyme regulation, and metabolic reprogramming.

By providing a sensitive, quantitative, and reproducible measurement of PDH enzymatic activity, it enables scientists to:

  • Investigate bioenergetic transitions between glycolysis and oxidative phosphorylation.

  • Assess mitochondrial health in physiological and pathological contexts.

  • Evaluate pharmacological modulators of metabolic pathways.

  • Support translational research in cancer, diabetes, aging, and neurological disorders.

This assay bridges biochemistry, cellular energetics, and biomedical engineering, providing a versatile foundation for next-generation metabolic analysis.

HIV-1 p24 ELISA Kit – Complete Technical Overview and Research Applications

The HIV-1 p24 ELISA Kit is a quantitative immunoassay designed to measure the core antigen p24 of the Human Immunodeficiency Virus type 1 (HIV-1).
This protein, encoded by the gag gene, forms the viral capsid, a structural shell surrounding the viral RNA genome. Because the p24 antigen appears early during infection—before antibodies are detectable—it serves as a critical marker for early HIV detection and viral replication monitoring in both clinical and research applications.

The Centers for Disease Control and Prevention (CDC) describes the p24 antigen as the key target in fourth-generation HIV tests, which detect both antigen and antibody to reduce the diagnostic window. (CDC.gov)

This kit also has broad research utility: it enables scientists to quantify HIV replication, validate lentiviral vector titers, and study viral protein expression during infection or gene therapy development.

Background: What is the HIV-1 p24 Antigen?

The p24 antigen is a 24 kDa capsid protein, part of the Gag polyprotein (Pr55-Gag), which is cleaved into several structural components: matrix (p17), capsid (p24), nucleocapsid (p7), and p6.
The p24 subunit forms the conical viral core, essential for virus assembly, maturation, and infectivity.

During viral replication, newly produced p24 is released into the bloodstream and can be detected by immunoassays long before anti-HIV antibodies are formed.
According to the National Institutes of Health (NIH), measuring p24 antigen levels is a powerful way to track viral load, disease progression, or treatment efficacy in controlled research settings.

The National Library of Medicine (NLM) includes thousands of peer-reviewed studies demonstrating that p24 detection correlates with viral RNA copies and is an essential metric in HIV pathogenesis studies and clinical virology.

AffiELISA® Extended Range HIV-1 p24 ELISA Kit, 96 wells

Principle of the HIV-1 p24 ELISA Assay

The Enzyme-Linked Immunosorbent Assay (ELISA) is based on the antigen–antibody binding principle.
Most p24 ELISA kits use a sandwich format, in which the p24 antigen is captured between two antibodies:

  1. Capture antibody (anti-p24 monoclonal) is pre-coated on the 96-well plate.

  2. Sample (containing p24 antigen) binds to the immobilized antibody.

  3. Detection antibody, also specific to p24, binds to another epitope on the same antigen.

  4. Enzyme conjugate (HRP) is added, followed by substrate (TMB).

  5. Optical density is measured at 450 nm, directly proportional to antigen concentration.

Protocols are standardized for sensitivity down to ~1 pg/mL, enabling accurate detection of trace antigen levels in serum, plasma, or cell culture supernatants.
For detailed methodology, see NIH Assay Development Resources.

The Importance of p24 Detection

 Early Infection Detection

The appearance of p24 precedes seroconversion by up to 10–15 days.
According to CDC HIV Laboratory Testing Guidelines, this reduces the window period significantly compared to antibody-only tests.

 Viral Load Correlation

Studies by the National Center for Biotechnology Information (NCBI) show a strong linear relationship between p24 antigen levels and plasma viral RNA concentration.
p24 quantification thus provides a cost-effective surrogate for viral RNA measurement in low-resource research environments.

 Lentiviral Vector Quantification

Gene-therapy production often relies on lentiviral vectors derived from HIV-1.
The p24 ELISA Kit enables vector titer quantification, a critical quality control step in production workflows.
The U.S. Food and Drug Administration (FDA) includes such antigen assays among the standard tools for viral vector characterization.

 Vaccine and Antiviral Research

In vaccine or drug development, p24 measurement helps monitor viral inhibition, immune response, and replication kinetics.
NIH-supported projects use p24 assays to evaluate the efficacy of vaccine candidates and antiretroviral compounds (NIH.gov).

Detailed Assay Workflow

Step 1: Sample Preparation

  • Human serum or plasma: Centrifuge at 2000×g for 10 min, remove supernatant, and store at −80 °C.

  • Cell culture supernatant: Filter or centrifuge to remove debris.

  • If immune complexes are suspected (p24 bound to antibodies), perform acid dissociation (1 N HCl + neutralization buffer). (Abcam Protocol)

Step 2: Standard Curve

Reconstitute recombinant p24 antigen and prepare serial dilutions (1000 pg/mL → 4.7 pg/mL).
This ensures accurate interpolation of unknown sample concentrations.

Step 3: Assay Procedure

  1. Add 100 µL standards and samples to pre-coated wells.

  2. Incubate 1 hour at room temperature.

  3. Wash wells (3–5 ×) with buffer to remove unbound material.

  4. Add 100 µL HRP-conjugate detection antibody.

  5. Incubate and wash again.

  6. Add TMB substrate; after color development, stop reaction with acid stop solution.

  7. Measure absorbance at 450 nm using a microplate reader.

Step 4: Data Analysis

  • Plot standard curve (OD 450 nm vs. p24 pg/mL).

  • Determine unknown sample concentrations by interpolation.

  • Report results with sample ID, dilution, and batch information for traceability.

For standardized calculation models, refer to the National Institute of Standards and Technology (NIST).

Analytical Performance

Parameter Typical Value Reference
Sensitivity 1 pg/mL Abcam.com
Dynamic Range 4.7–1000 pg/mL R&D Systems
Intra-assay CV 3–4 % R&D Systems
Inter-assay CV ≤ 8 % CellBioLabs
Assay Time 2–3 hours
Sample Volume 100 µL

Technical Considerations

  • Sample quality strongly influences accuracy. Hemolysis or lipemia may interfere with optical readings. (CDC Biospecimen Quality Standards)

  • Immune complex dissociation is critical for chronic samples; omitting this step can lead to underestimation.

  • Temperature and incubation time must be consistent to ensure reproducibility.

  • Proper calibration of microplate readers (450 nm) is essential for linear standard curves.

  • Matrix effects (e.g., serum vs. plasma vs. cell supernatant) should be evaluated through spiked recovery tests.

Laboratories following NIH biosafety level 2 (BSL-2) guidelines must handle infectious materials in certified biosafety cabinets (NIH Biosafety Manual).

Advantages of Commercial HIV-1 p24 ELISA Kits

  • High Sensitivity: Detects antigen concentrations as low as 1 pg/mL.

  • Quantitative Measurement: Provides numerical data for viral load studies.

  • Broad Sample Compatibility: Works with serum, plasma, and culture media.

  • Standardization: Pre-coated wells and reagents ensure consistency.

  • High Throughput: 96-well format supports parallel testing.

  • Cost-Efficiency: Simpler and cheaper than RNA-based viral load assays.

  • Automation Ready: Compatible with automated ELISA platforms.

Kits like the Abcam HIV-1 p24 ELISA Kit or the CellBioLabs Lentiviral p24 Assay demonstrate reproducible, validated performance in research laboratories worldwide.

Common Limitations

  • Reduced sensitivity after seroconversion: Once antibodies bind p24, free antigen concentration drops.

  • Matrix interference: Serum proteins or sample contaminants can inhibit binding.

  • Not diagnostic unless FDA-approved: Research kits (RUO) must not be used for clinical diagnosis.

  • Manual pipetting errors: ELISA precision requires careful handling.

  • Storage stability: Components should be stored at 2–8 °C; repeated freeze-thaw cycles degrade antibodies.

The U.S. Environmental Protection Agency (EPA) provides guidelines for safe disposal of chemical reagents and biological waste from ELISA procedures.

Research and Biotechnology Applications

 HIV-1 Pathogenesis

Quantifying p24 enables researchers to monitor viral replication kinetics in in vitro cell cultures, PBMCs, and macrophage systems.
The NIH Office of AIDS Research funds studies that use p24 assays to understand viral replication cycles and immune evasion.

 Gene Therapy and Lentiviral Production

Gene therapy platforms using HIV-derived lentiviral vectors rely on p24 quantification for vector titration and batch consistency.
FDA and NIST recommend inclusion of p24 assays in vector release testing pipelines for potency assessment (FDA.gov).

 Vaccine and Antiviral Drug Development

In vaccine trials, reduction of p24 levels after immunization indicates neutralization activity or immune suppression of viral replication.
The ClinicalTrials.gov database lists multiple HIV vaccine trials using p24 ELISA endpoints.

 Diagnostic Algorithm Research

Fourth-generation HIV tests that include p24 detection shorten the diagnostic window.
The University of Washington HIV Curriculum describes p24’s role in diagnostic strategies.

 Educational and Training Use

In academic institutions such as Harvard University, p24 ELISA serves as a teaching model to explain antigen–antibody interactions, quantitative immunoassay principles, and biosafety practices.

Biosafety and Waste Management

  • Follow BSL-2 containment for HIV-related materials (NIH Guidelines).

  • Decontaminate liquid waste with 10 % bleach or autoclaving before disposal.

  • Use biohazard labeling per OSHA laboratory safety rules.

  • Store kit reagents separately from infectious materials.

  • Dispose of used microplates following EPA hazardous waste guidelines (EPA.gov).

Example Product – Rapid-Lenti™ HIV-1 p24 ELISA Kit (Research Use Only)

  • Detection Range: 4.7–1000 pg/mL

  • Sample Types: cell culture supernatant, serum, plasma

  • Assay Time: 3 hours

  • Reproducibility: CV ≤ 10 %

  • Application: Lentiviral vector quantification and HIV-1 p24 antigen analysis

Such kits are available from biotechnology suppliers like Affigen, Gentaur, and Abcam, offering standard protocols for both manual and automated ELISA systems.

Future Perspectives

The next generation of p24 assays is moving toward nanobody-based detection and electrochemical ELISA platforms, which further lower detection limits to femtogram levels.
Integration with microfluidic chips and biosensor systems allows real-time detection of HIV antigens from minimal sample volumes.
The U.S. Department of Energy (DOE) and NIH Innovation Programs support miniaturized diagnostic platforms for field use (Energy.gov, NIH.gov).

Conclusion

The HIV-1 p24 ELISA Kit remains a cornerstone assay in virology and biotechnology.
It provides a sensitive, quantitative, and cost-effective method for measuring the p24 core antigen in research samples — essential for early detection, viral load assessment, vaccine evaluation, and gene-therapy quality control.

By following standardized workflows and biosafety protocols, researchers can achieve reproducible and accurate results aligned with quality standards established by CDC, NIH, FDA, and NIST.

This assay bridges fundamental immunology with applied biotechnology, empowering scientists worldwide to better understand HIV biology, improve therapeutics, and advance diagnostic innovations.

Plasma Membrane Isolation Kit — Comprehensive Technical Overview

The Plasma Membrane Isolation Kit is a powerful tool designed for rapid and reproducible enrichment of plasma membrane fractions from mammalian cells or tissues.
It enables researchers to selectively isolate the outer cellular membrane, separating it from organelles, cytoplasm, and nuclear debris.
This process is fundamental in membrane proteomics, signal transduction research, receptor analysis, and drug-target discovery.

The plasma membrane, sometimes referred to as the cell membrane, is a dynamic lipid bilayer composed mainly of phospholipids, cholesterol, glycolipids, and membrane proteins. It acts as a selective barrier and communication hub between the intracellular and extracellular environments. According to the National Center for Biotechnology Information (NCBI), membrane organization determines critical processes like transport, adhesion, and receptor signaling.

Scientific Background

The plasma membrane is not just a static envelope but a biologically active interface that regulates ion transport, endocytosis, exocytosis, and intracellular signaling.
Membrane proteins account for over 30 % of all encoded genes in eukaryotes (NCBI Gene Database), yet their study remains challenging due to their low abundance and hydrophobic nature.

Subcellular fractionation — the separation of cellular components — was historically performed by density gradient ultracentrifugation, a labor-intensive process requiring complex buffers and multiple steps.
Modern Plasma Membrane Isolation Kits replace these manual processes with pre-optimized reagents and standardized gradients, enabling consistent recovery of highly enriched plasma membrane fractions.

Learn more about organelle isolation principles at PubMed Central and National Library of Medicine.

AffiPREP® Plasma Membrane Isolation Kit

Importance of Plasma Membrane Isolation

The plasma membrane defines cellular identity and mediates environmental communication. Its isolation is essential for:

  • Membrane protein characterization (channels, receptors, transporters)

  • Quantitative proteomics for biomarker discovery

  • Drug-binding and receptor-ligand interaction studies

  • Signal transduction assays involving phosphorylation events

  • Lipidomics for membrane composition analysis

According to the National Institutes of Health (NIH), plasma membrane proteins are key pharmacological targets, accounting for more than 60 % of all drug-binding proteins in clinical medicine.
Accurate isolation and purification ensure that downstream analyses reflect true membrane biology rather than contamination from cytosolic or mitochondrial components.

Principle of the Plasma Membrane Isolation Kit

The kit workflow is based on differential centrifugation and density gradient separation.
Each reagent is pre-formulated to optimize membrane integrity and purity.

Main Steps:

  1. Cell or tissue homogenization
    Mechanical disruption under cold conditions releases intracellular components while maintaining membrane structure.
    The Centers for Disease Control and Prevention (CDC) recommends processing samples on ice to prevent protease activation.

  2. Centrifugation and debris removal
    Low-speed centrifugation removes nuclei and unbroken cells.
    The supernatant (post-nuclear fraction) contains membranes, cytoplasm, and organelles.

  3. Density gradient separation
    High-speed ultracentrifugation (~200,000×g) in a sucrose or OptiPrep™ gradient separates the plasma membrane based on buoyant density.
    The membrane fraction appears as a white band at the interface between two gradient layers.

  4. Membrane washing and resuspension
    The band is collected, diluted, and washed to remove cytosolic contaminants.
    Membrane pellets are then resuspended in an appropriate buffer for downstream use.

This technique is adapted from early studies in membrane biochemistry (PubMed) and remains essential in cell fractionation science.

Detailed Workflow Using a Commercial Kit

. Sample Preparation

  • Harvest 10⁷ – 10⁸ cells or 100–500 mg of tissue.

  • Wash twice with ice-cold PBS to remove serum proteins.

  • Prepare lysis buffer containing protease inhibitors (FDA Laboratory Best Practices).

. Homogenization

  • Homogenize on ice using a Dounce homogenizer (20–30 strokes).

  • Inspect under microscope for ~70 % lysis without nuclear damage.

. Post-nuclear Supernatant (PNS)

  • Centrifuge at 700 ×g for 10 min.

  • Transfer the supernatant to a new tube and keep on ice.

. Gradient Formation

  • Prepare a discontinuous gradient (e.g., 2.5 % and 25 % iodixanol).

  • Layer PNS on top and centrifuge at 200,000×g for 90 min at 4 °C (NIST.gov).

. Membrane Collection

  • Collect the visible interface between the two layers containing plasma membranes.

  • Dilute with buffer and re-centrifuge at 20,000×g to pellet membranes.

. Validation

  • Use Na⁺/K⁺-ATPase as a plasma membrane marker.

  • Use GAPDH or α-tubulin to check for cytosolic contamination.

  • Perform western blot or immunostaining using antibodies validated by The Human Protein Atlas.

. Downstream Analysis

Scientific Applications

. Membrane Proteomics

The plasma membrane hosts critical receptors (GPCRs, RTKs), ion channels, and transporters.
By enriching this fraction, scientists can detect low-abundance proteins via LC-MS.
The National Institute of General Medical Sciences (NIGMS) supports plasma membrane proteomics as part of systems-biology initiatives.

. Signal Transduction Studies

Isolated plasma membranes preserve phosphorylation sites and allow precise study of receptor activation.
This is particularly relevant in oncology and neuroscience. (NIH Cancer Institute)

. Drug Discovery

More than half of known drug targets are located on the plasma membrane.
Isolated fractions allow in-vitro drug-binding and receptor-occupancy studies (NCBI DrugBank).

. Lipidomics and Metabolomics

The plasma membrane’s lipid composition (phosphatidylcholine, cholesterol, sphingomyelin) defines its fluidity and function.
Lipidomics analysis after isolation enables comparison of diseased vs. healthy cell states (NIST Metabolomics Standards).

. Immunology and Virology

Pathogens often target or remodel host plasma membranes.
Purified membranes help identify virus entry receptors and immune signaling mechanisms (CDC Immunology Division).

Technical Notes and Best Practices

Step Key Parameter Rationale
Temperature 4 °C or on ice Prevent protease and phosphatase activity
Homogenization 20–30 strokes Maximize cell lysis without nuclear rupture
Gradient type OptiPrep or sucrose Achieves clear separation by density
Validation Na⁺/K⁺-ATPase, Caveolin-1 Confirm membrane fraction purity
Sample input ≥ 10⁷ cells Ensures sufficient yield for downstream work

According to the NIH Office of Research Infrastructure Programs, maintaining temperature and pH stability is crucial for high-integrity membrane recovery.

Common Challenges and Troubleshooting

  1. Low yield – Often caused by incomplete lysis or over-homogenization. Adjust strokes or buffer composition.

  2. Contamination – Cytosolic carryover occurs when gradient separation is insufficient; verify centrifugation speed.

  3. Protein degradation – Always add fresh protease inhibitors; see FDA Biospecimen Guidelines.

  4. Gradient mixing – Layer gradients carefully with narrow pipettes; avoid turbulence.

  5. Storage – Store isolated membranes at –80 °C in aliquots under nitrogen (CDC Laboratory Practices).

Advantages of the Plasma Membrane Isolation Kit

  • Speed and reproducibility compared to manual gradient methods

  • Improved safety, no harsh organic solvents

  • Scalable for multiple sample sizes

  • Validated buffers ensure consistent results across labs

  • Compatibility with LC-MS, western blot, and enzymatic assays

  • High purity confirmed by organelle-specific marker analysis

Commercial examples include Abcam Plasma Membrane Isolation Kit (ab284937) and similar systems described in NIST.gov biochemical methodology.

Integration with Other Subcellular Fractionation Techniques

Researchers often combine plasma membrane isolation with additional fractionation (e.g., cytosolic, mitochondrial, nuclear).
According to PubMed Central, combining multiple purification steps increases purity by > 85 %.
Validated subcellular workflows are crucial for accurate interpretation in multi-omics studies (NIH Metabolomics Program).

 Environmental and Safety Considerations

Following guidelines from the U.S. Environmental Protection Agency (EPA), all chemical waste generated during isolation (buffers, detergents) must be disposed of properly.
Work in a cold environment with personal protective equipment (lab coat, gloves, safety glasses) as recommended by OSHA Laboratory Safety Standards.

Example: AffiEXTRACT® Plasma Membrane Isolation Kit (Affigen)

  • Designed for mammalian cell cultures and tissues

  • Uses optimized non-ionic buffer system for efficient plasma membrane release

  • Produces high yield with minimal organelle contamination

  • Suitable for western blot, proteomics, or receptor assays

  • Contains all reagents including gradient media, inhibitors, wash buffers, and detailed instructions

  • Manufactured under ISO-certified and REACH-compliant facilities

Explore more: Affigen Plasma Membrane Isolation Kit.

 Future Developments in Membrane Isolation

The field of membrane proteomics is advancing rapidly, with automation and microfluidic-based isolation systems under development.
Emerging “lab-on-a-chip” isolation kits use nanostructured surfaces and immuno-affinity beads for selective capture of plasma membranes.
The Department of Energy (DOE) and NIH BRAIN Initiative support innovations integrating microfluidics for single-cell membrane analysis (energy.gov, nih.gov).

 Conclusion

The Plasma Membrane Isolation Kit is an essential instrument in cellular and molecular biology.
It provides a standardized, reproducible method for isolating high-purity plasma membrane fractions — vital for proteomic, lipidomic, and pharmacological research.
By minimizing contamination, ensuring consistent yield, and protecting sample integrity, these kits empower scientists to explore membrane-associated mechanisms with unprecedented accuracy.

Adopting a validated kit ensures compliance with quality standards set by NIST, NIH, EPA, and FDA, while enhancing reproducibility across laboratories.
Whether used for receptor mapping, ion channel analysis, or signal transduction assays, this technology represents the bridge between cellular structure and molecular function — supporting discoveries in biochemistry, neuroscience, oncology, and drug development.